
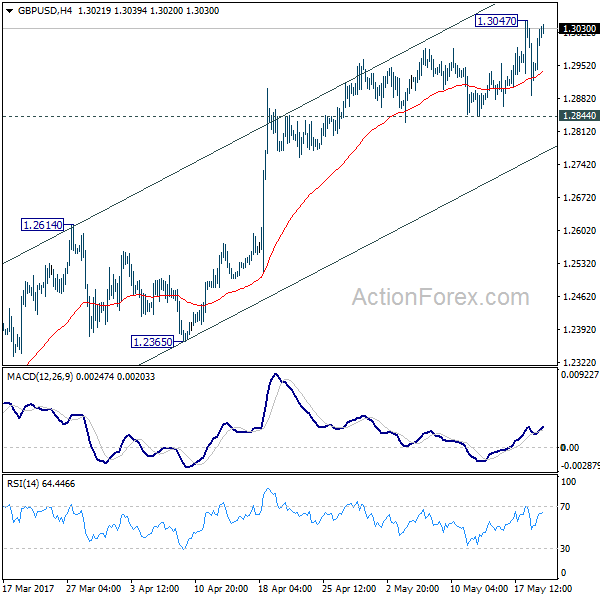
GBP/USD rose to 1.3047 last week but quickly lost momentum again and turned sideway. Initial bias remains neutral this week first. Further rise is in favor as long as 1.2844 support holds. However, as we are still viewing price actions from 1.1946 as a corrective move, we’d expect upside to be limited below 1.3444 resistance to bring near term reversal. On the downside, break of 1.2844 will indicate short term topping and turn bias back to the downside for 1.2614 resistance turned support first.
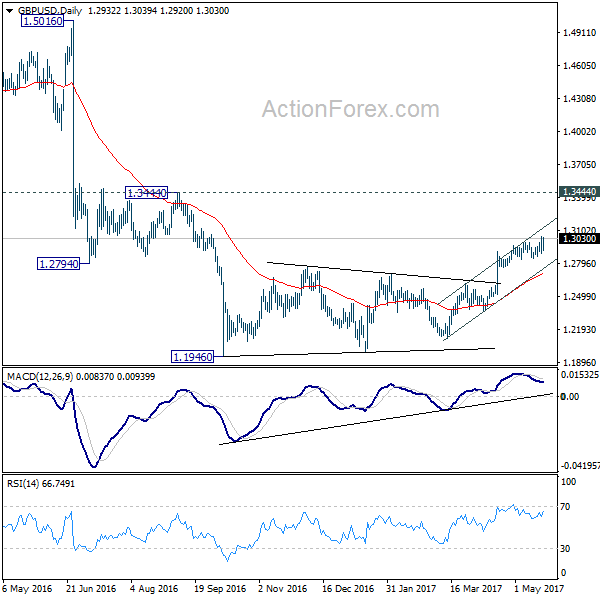
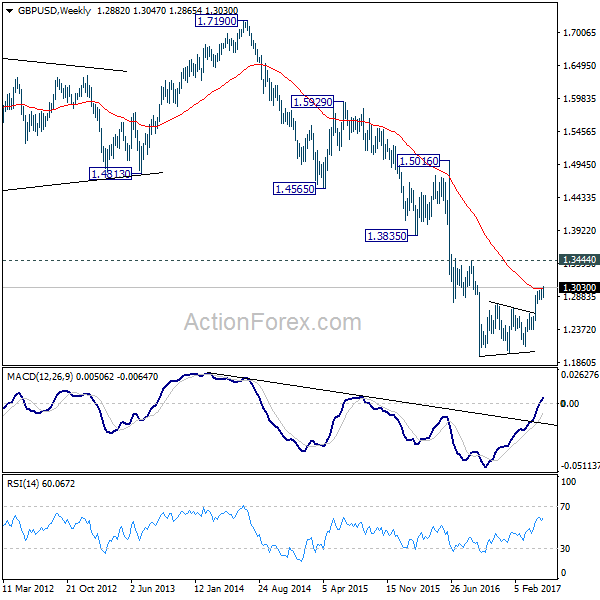
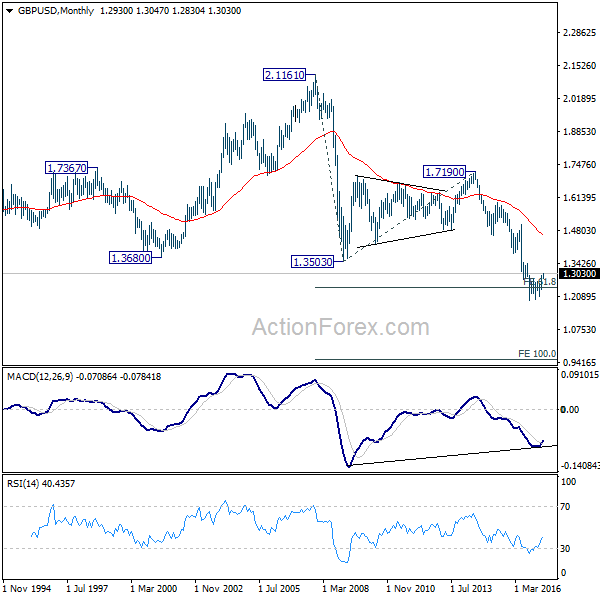
In the bigger picture, fall from 1.7190 is seen as part of the down trend from 2.1161. There are signs of reversal, like breaking of 55 week EMA, weekly MACD turned positive, and monthly MACD crossed above signal line. But still, break of 1.3444 resistance is need to confirm medium term bottoming. Otherwise, outlook will remains bearish for extend the down trend through 1.1946 low.
In the longer term picture, no change in the view that down trend from 2.1161 is still in progress. On resumption, such decline would extend deeper to 100% projection of 2.1161 to 1.3503 from 1.7190 at 0.9532.


