
The EUR/USD currency pair
Technical indicators of the currency pair:
Prev Open: 1.14675
Open: 1.14111
% chg. over the last day: -0.56
Day’s range: 1.13931 – 1.14113
52 wk range: 1.1214 – 1.2557
Yesterday EUR/USD was in a bearish mood. The quotes descended by more than 100 points. Right now the trading instrument is in the sideways movement. The key levels are 1.13900 and 1.142520. You should open positions from the key levels, but consider that the pair has further descend prospects.
The Economic News Feed for 16.01.2019:
Retail Sales Reprort (US) – 15:30 (GMT+2:00);
Federal Reserve’s Beige Book (EU) – 21:00 (GMT+2:00);
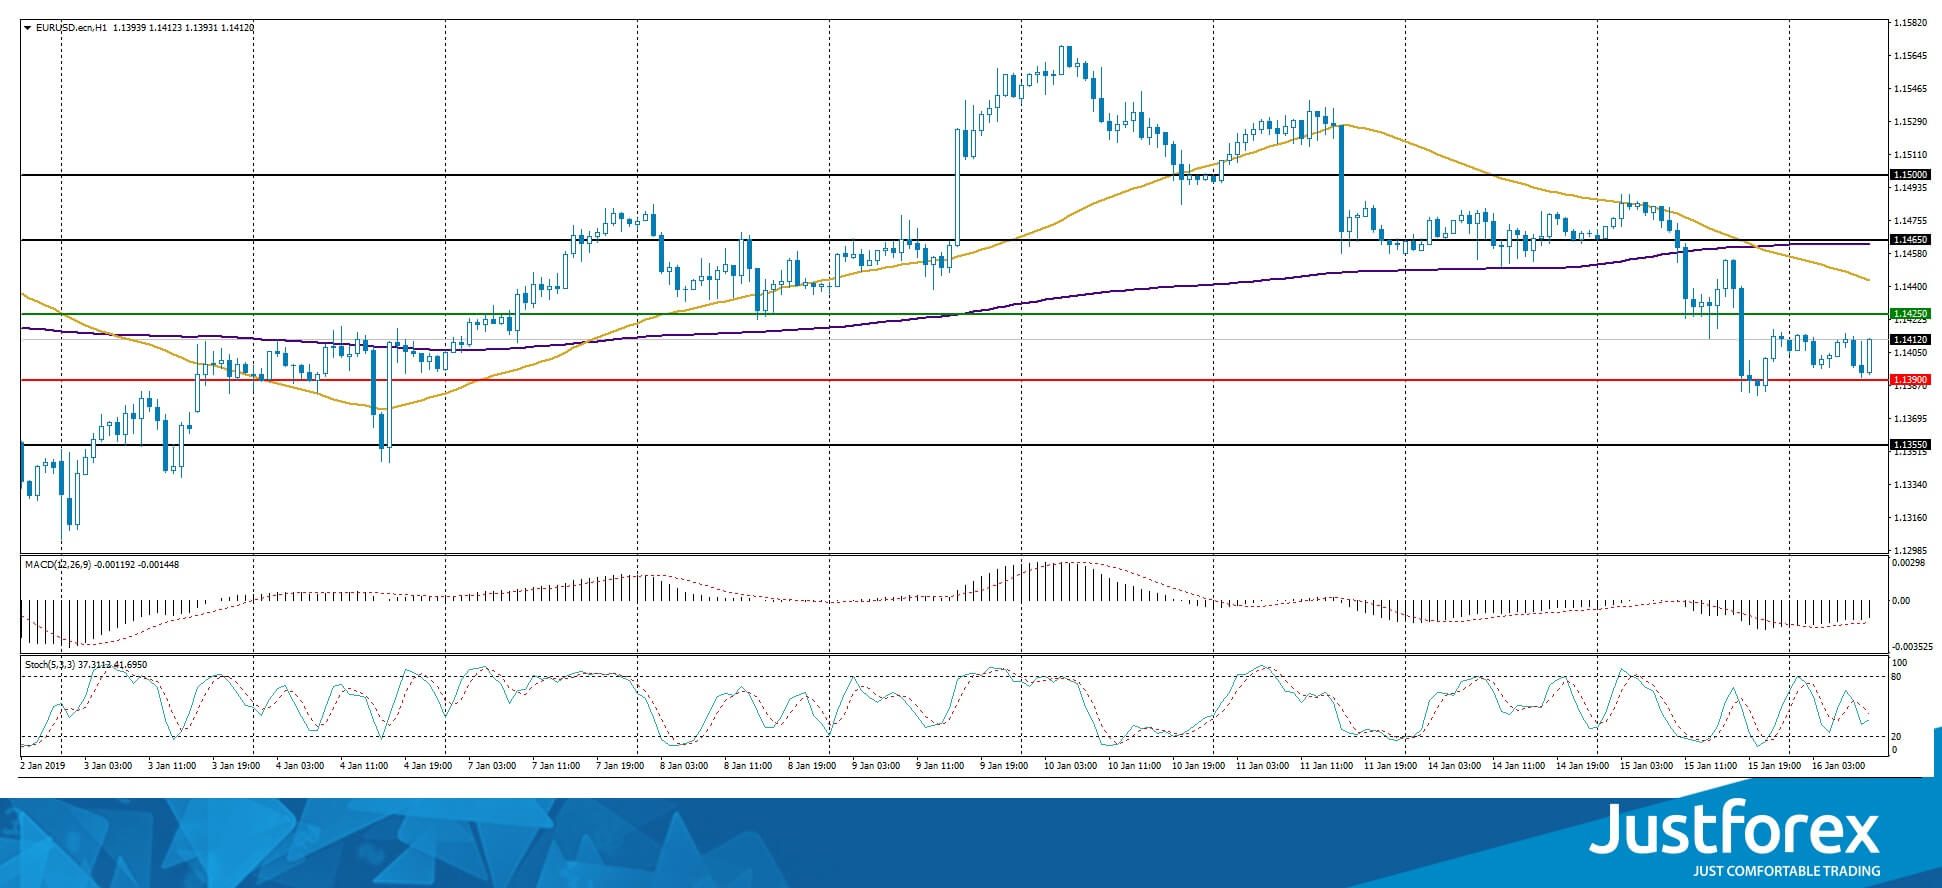
The indicators point to the power of the buyers, the price fixed below 50 MA and 200 MA.
The MACD histogram is in the negative zone but above the signal line which gives a weak signal to sell EUR/USD.
The Stochastic Oscillator is in the neutral zone but above the signal line which gives a weak signal to sell EUR/USD.
Trading recommendations
Support levels: 1.13900, 1.13550
Resistance levels: 1.14250, 1.14650, 1.15000
If the price fixes below the local support of 1.13900 expect further descend toward 1.13550-1.13200.
Alternatively the quotes can grow toward 1.14650-1.14800.
The GBP/USD currency pair
Technical indicators of the currency pair:
Prev Open: 1.28560
Open: 1.28833
% chg. over the last day: +0.05
Day’s range: 1.28556 – 1.28954
52 wk range: 1.2438 – 1.4378
1.2438 – 1.4378
At 11:15 (GMT+2:00) the UK will publish the consumer price index.
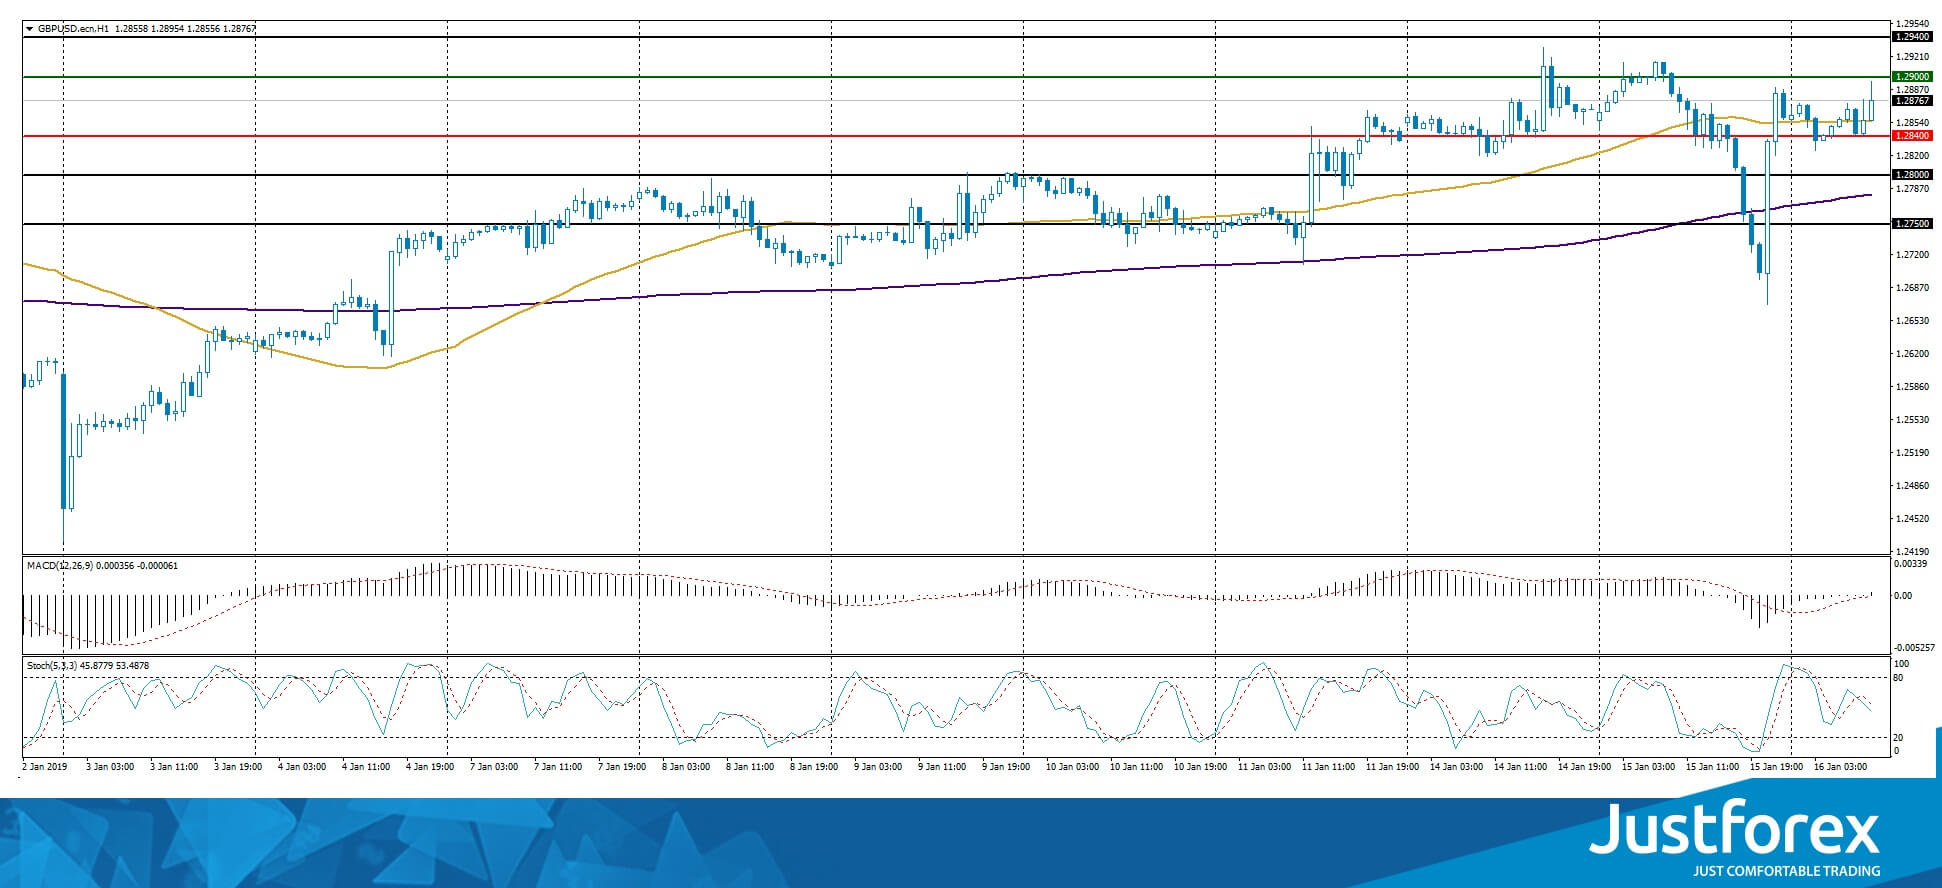
Indicators do not provide precise signals, the price has crossed 50 MA.
The MACD histogram is close to 0.
The Stochastic Oscillator is in the neutral zone, the %K line is below the %D line, which points to a bearish mood.
Trading recommendations
Support levels: 1.28400, 1.28000, 1.27500
Resistance levels: 1.29000, 1.29400
If the price fixes below 1.28400, look for the market entry points to open short positions. The movement will tend toward 1.2800-1.27800.
Alternatively the quotes can grow toward 1.29400-1.29600.
The USD/CAD currency pair
Technical indicators of the currency pair:
Prev Open: 1.32817
Open: 1.32685
% chg. over the last day: -0.20
Day’s range: 1.32452 – 1.32545
52 wk range: 1.2248 – 1.3664
The USD/CAD are moving sidewards. The investors are waiting for additional drivers. You should keep an eye on the oil quotes dynamics. The key support and resistance levels are 1.32350 and 1.32700. Positions should be opened from the key levels.
The Economic News Feed for 16.01.2019 is calm.
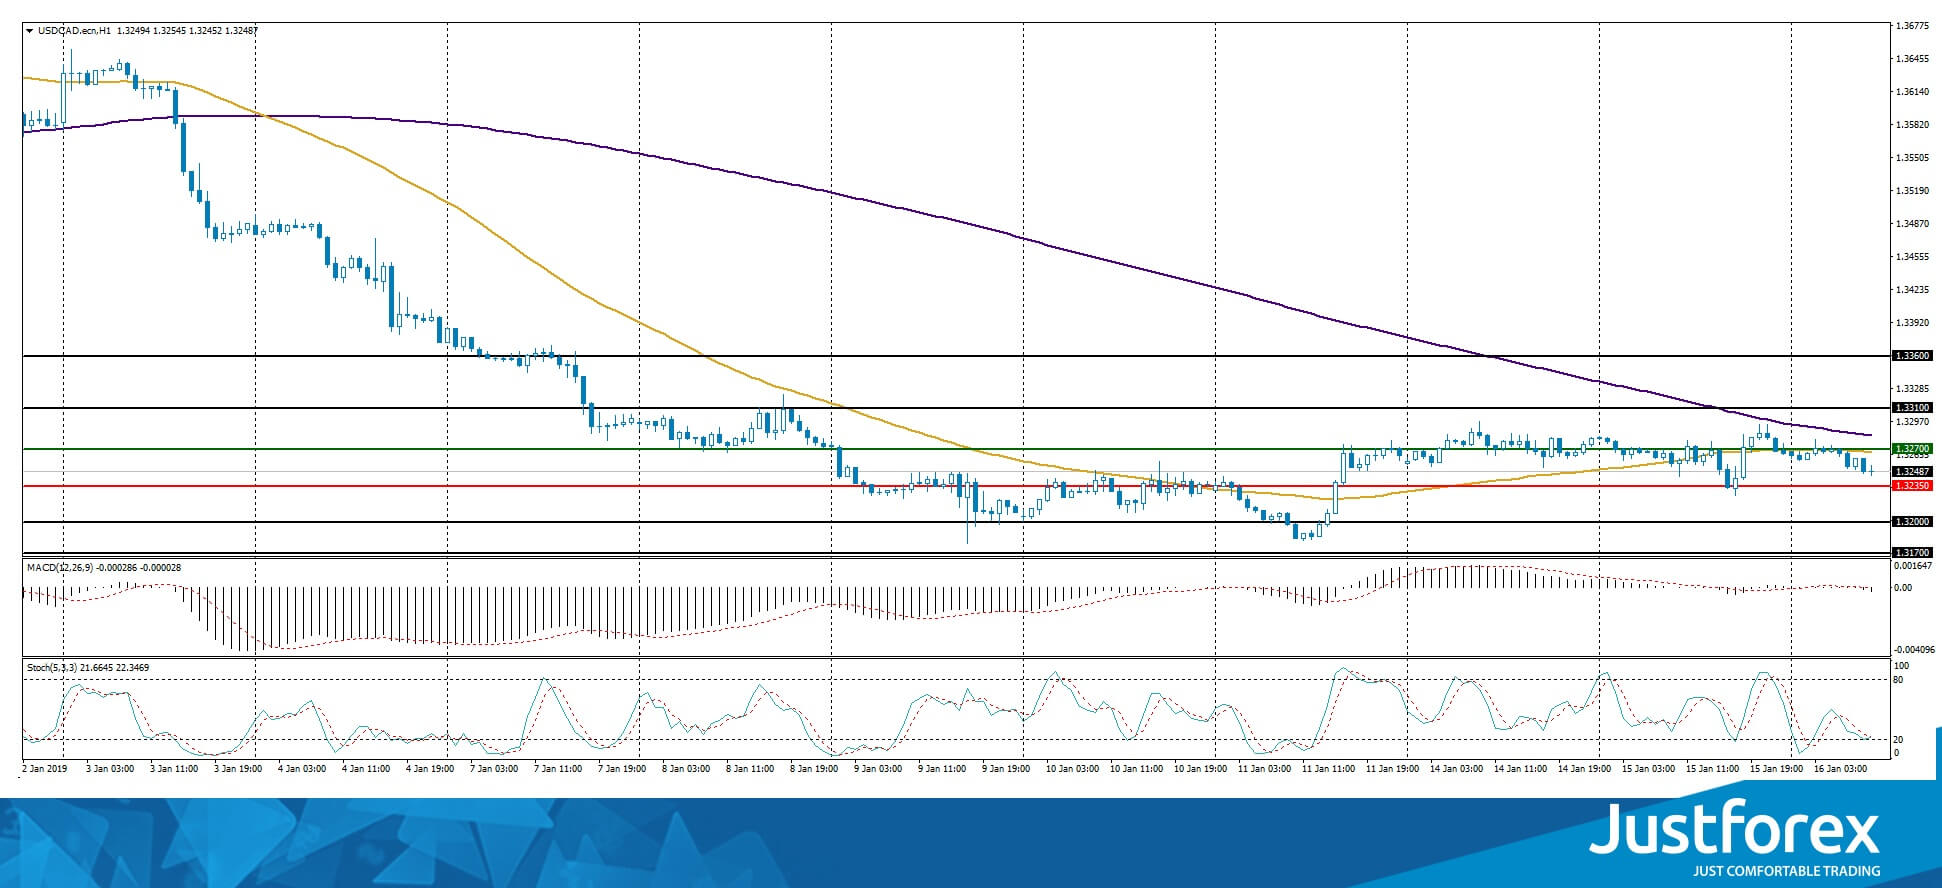
The price fixed below 50 NA and 200 MA which points toward a bearish mood.
The MACD histogram is close to 0. There are no signals.
The Stochastic Oscillator is close to the oversold zone, the %K line is crossing the %D line. There are no precise signals.
Trading recommendations
Support levels: 1.32350, 1.32000
Resistance levels: 1.32700, 1.33100, 1.33600
If the price fixes above 1.32700 you should consider buying USD/CAD. The movement will tend toward 1.33100-1.33300.
Alternatively the quotes can fall toward 1.32000-1.31700.
The USD/JPY currency pair
Technical indicators of the currency pair:
Prev Open: 108.154
Open: 108.653
% chg. over the last day: +0.45
Day’s range: 108.546 – 108.641
52 wk range: 104.56 – 114.56
Yesterday the USD/JPY was in a bullish mood. The quotes grew by more than 60 points. This mood remains. The key levels are 108.4501 and 108.700. You should open positions from them and consider that the quotes have prospects for further growth.
The Economic News Feed for 16.01.2019 is calm.
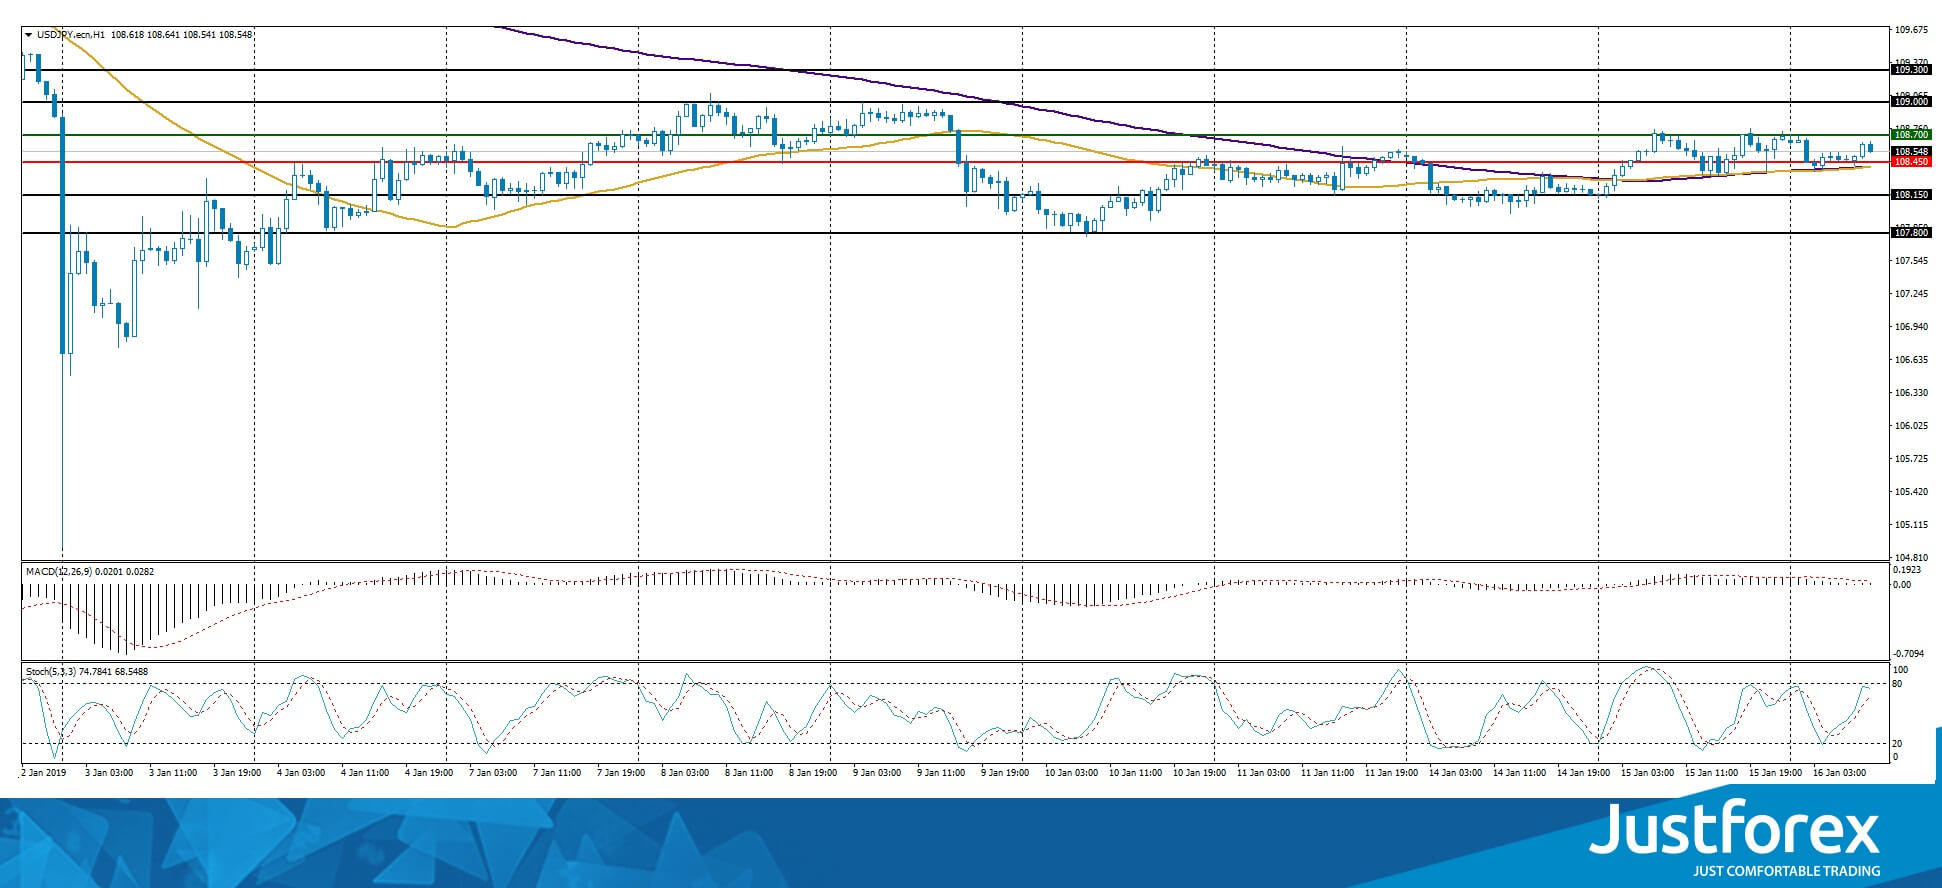
The indicators do not provide precise signals, 50 MA has crossed 200 MA.
The MACD histogram is in the positve zone but below the signal line, which gives a weak signal to buy USD/JPY.
The Stochastic Oscillator is in the neutral zone, the %K line is above the %D line which points to a bullish mood.
Trading recommendations
Support levels: 108.450, 108.150, 107.800
Resistance levels: 108.700, 109.000, 109.300
If the price fixes above 108.700 expect the quotes to grow toward 109.000-109.200.
Alternatively the quotes can fall toward 108.150-108.000.


