
Technical
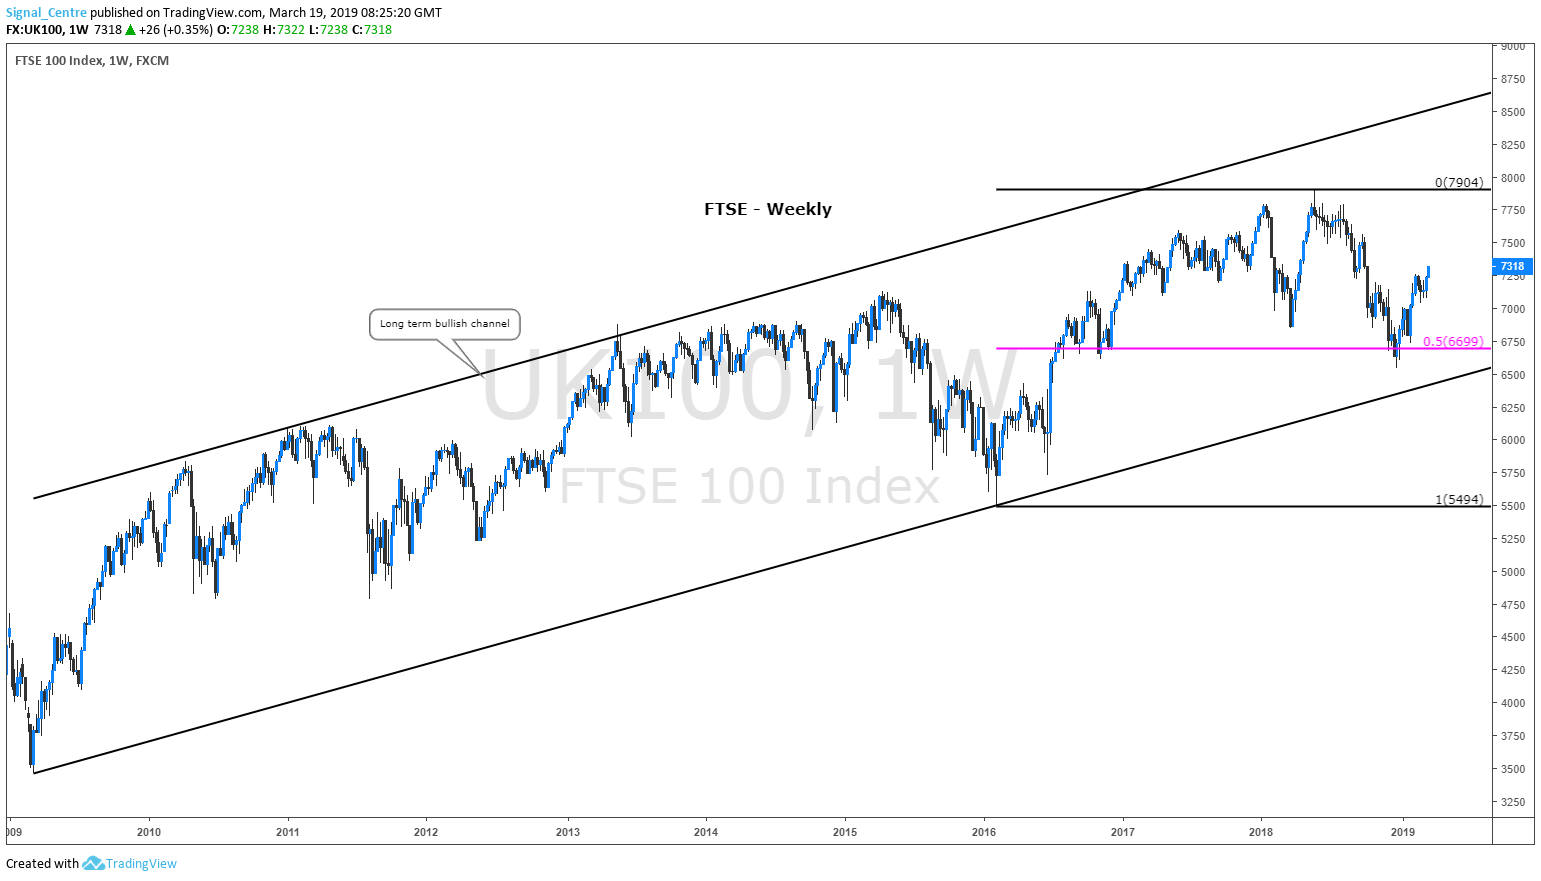
Weekly: Trading within a long-term bullish channel. The recent corrective move from the highs at 7904 stalled at the 50% Fibonacci retracement level (6699). Buyers were found at this level and the market has rallied. There is no sign that the long-term bullish sequence is stalling.
Daily: A break of bespoke resistance at 7261, and the move higher is already underway. Broken out of the Head and Shoulders formation to the upside. The formation has a measured move target of 7904. The continuation higher in prices through resistance has been impressive with strong momentum and shows no signs of slowing. 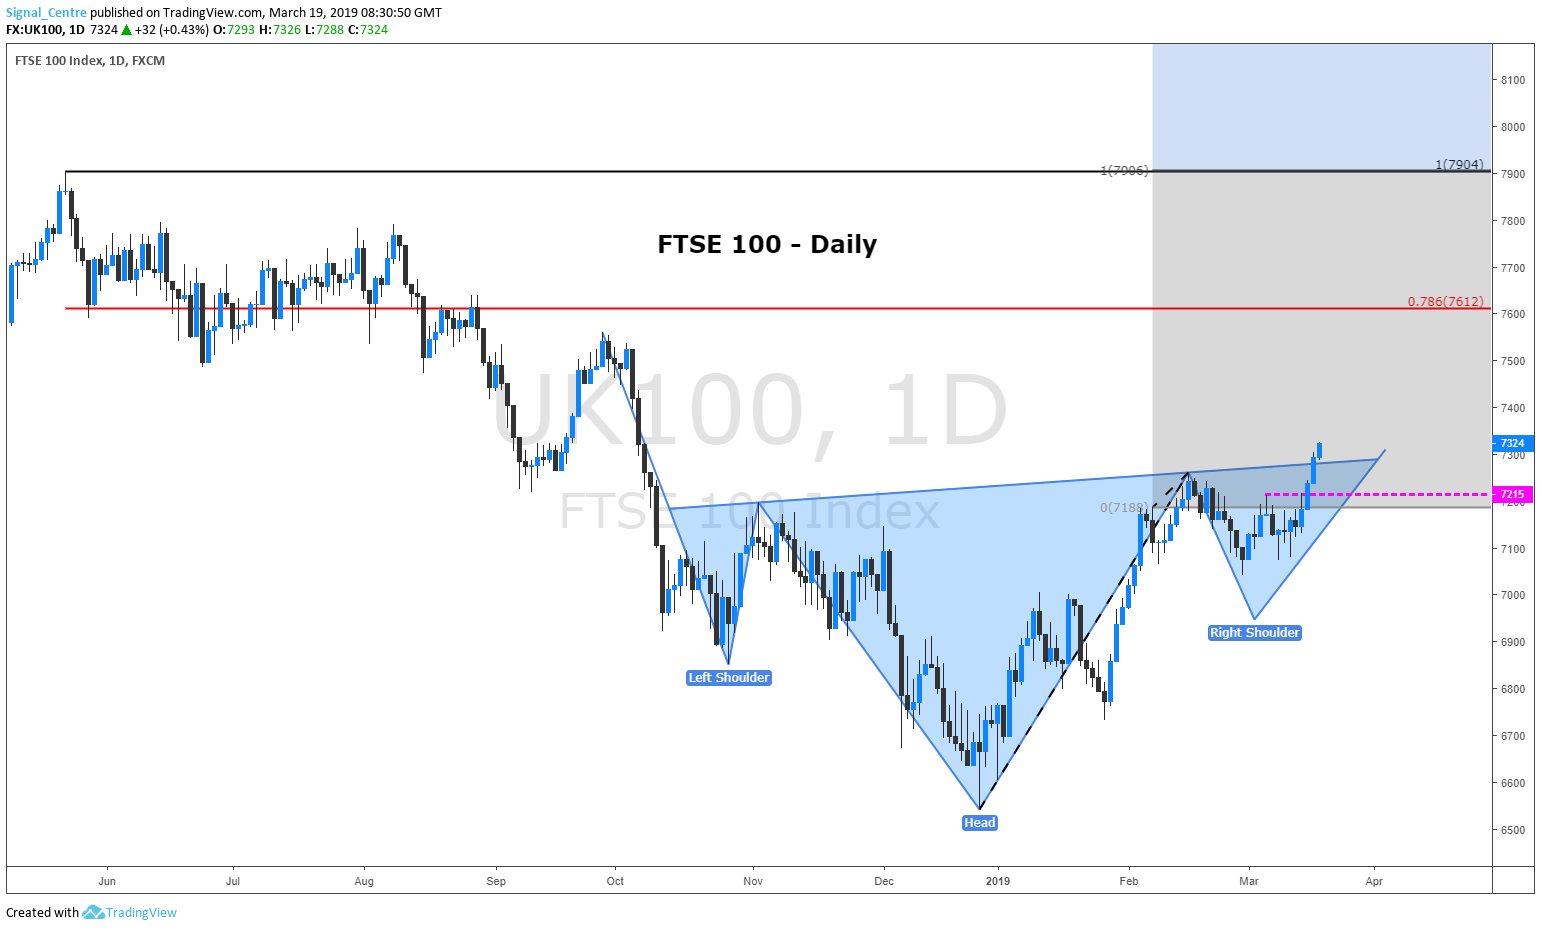
Intraday: Broken out of the range formation to the upside. The medium-term bias remains bullish. Positive overnight flows lead to an expectation of a firm open this morning. News events could adversely affect the short-term technical picture. Preferred trade is to buy on dips. 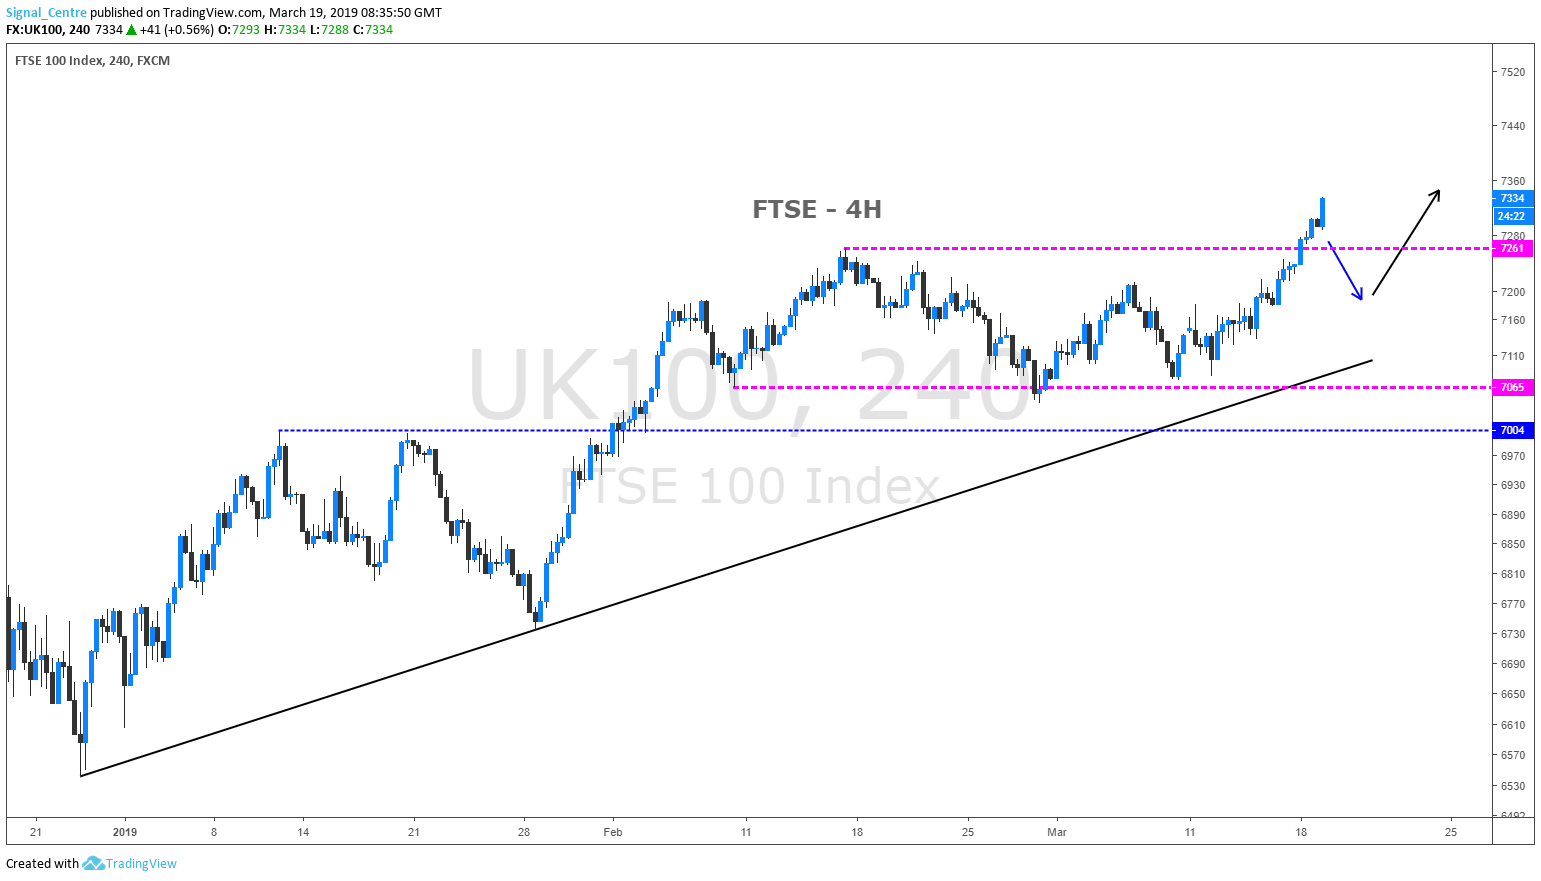
Action: We look to buy on pullbacks towards 7215
Stop: Stops to be placed at 7120
Targets: 7600 & 7900


