Global financial markets ended last week with an unmistakable sense of caution. Brent crude climbed back to $100 for the first time since May and posted a weekly gain of almost 12%, reflecting growing concern that disruptions to global oil supplies are becoming more widespread. Even so, broader markets have yet to display signs of outright panic. Treasury yields, Dollar and major equity indices are approaching important technical thresholds, but none has yet confirmed that investors are fully embracing a stagflation scenario.
The difference from the initial US-Iran conflict in February is that today’s risks extend well beyond the Strait of Hormuz. While the US has now conducted 13 consecutive days of strikes against Iran and diplomatic prospects remain remote, tensions have simultaneously spread to two additional shipping routes. In the Red Sea, Houthi attacks on Saudi tankers threaten the alternative export route that had helped reduce dependence on Hormuz. In the Black Sea, attacks linked to the Russia-Ukraine conflict have forced the Caspian Pipeline Consortium to suspend crude loadings, disrupting the overwhelming majority of Kazakhstan’s oil exports.
Equally important, the world is confronting these disruptions with far less room for error. Global oil inventories have been substantially depleted over recent months, leaving the market less able to absorb supply interruptions than it was earlier this year. The combination of lower inventories and simultaneous threats across three geographically distinct shipping corridors has materially increased the risk that temporary disruptions evolve into a more sustained supply shock.
Markets are not behaving as though such an outcome is inevitable, but they are clearly preparing for the possibility. The next stage of this story will not be determined by headlines alone. It will be reflected in whether five key market indicators—Brent crude, Treasury yields, equities and Dollar—break the levels that would signal a much broader repricing of inflation, monetary policy and global growth.
Brent Crude: First and Most Important Signal
Brent crude remains the market’s most important indicator because it is the source of the current macro risks rather than a reaction to them. Treasury yields, central bank expectations, Dollar and equities all respond to changes in inflation and growth expectations, but oil directly reflects how traders assess the balance between physical supply and demand. As long as the supply outlook remains uncertain, Brent will continue to lead broader market pricing.
The latest rally has been driven by more than geopolitical headlines. With simultaneous disruptions threatening exports through the Strait of Hormuz, Red Sea and Black Sea, the market is increasingly pricing the possibility that global supply losses could become both larger and more prolonged. That concern is amplified by depleted global inventories, leaving far less buffer than was available during the initial US-Iran conflict earlier this year. Even if actual production losses remain limited, longer shipping routes, higher insurance costs and transport delays all tighten effective supply and raise the marginal cost of crude.
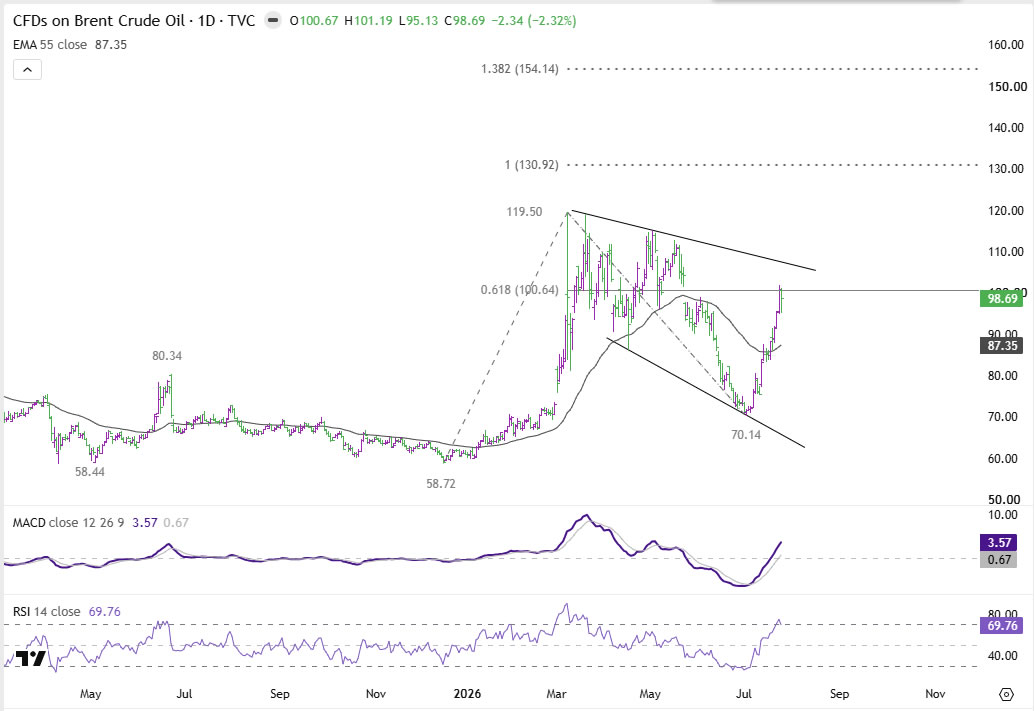
Technically, Brent’s sharp advance over the past two weeks argues that the decline from 119.50 has already completed as a three-wave correction at 70.14. The rally may now pause after reaching 61.8% retracement of 119.50 to 70.14 at 100.64. Some near-term consolidation would not be surprising following such a rapid advance. However, the broader risk remains firmly skewed to the upside as long as any pullback is contained above the rising 55 D EMA, now at 87.35. Sustained break above 100.64 would pave the way for a retest of 119.50.
More importantly, completion of the correction from 119.50 raises the possibility that the longer-term uptrend from 58.72 has resumed. Decisive break of 119.50 would expose 100% projection of 58.72 to 119.50 from 70.14 at 130.92, while 138.2% projection at 154.14 could become a realistic objective should supply disruptions deepen and inventories tighten further.
Treasury Yields: Waiting for Bond Market Confirmation
If Brent crude is the market’s first warning signal, Treasury yields are likely to provide the next confirmation. Oil prices can spike on geopolitical headlines, but sustained increases in bond yields indicate investors are beginning to reassess inflation, Federal Reserve policy and the broader macro outlook. Watching both the 2-year and 10-year Treasury yields together offers the clearest picture of whether that transition is taking place.
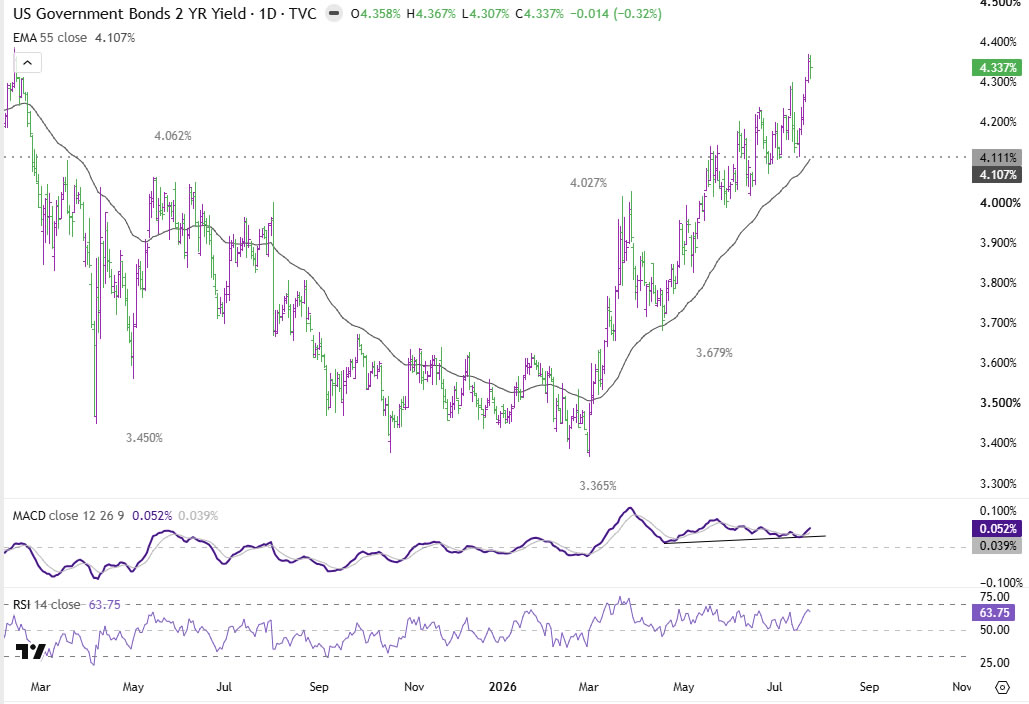
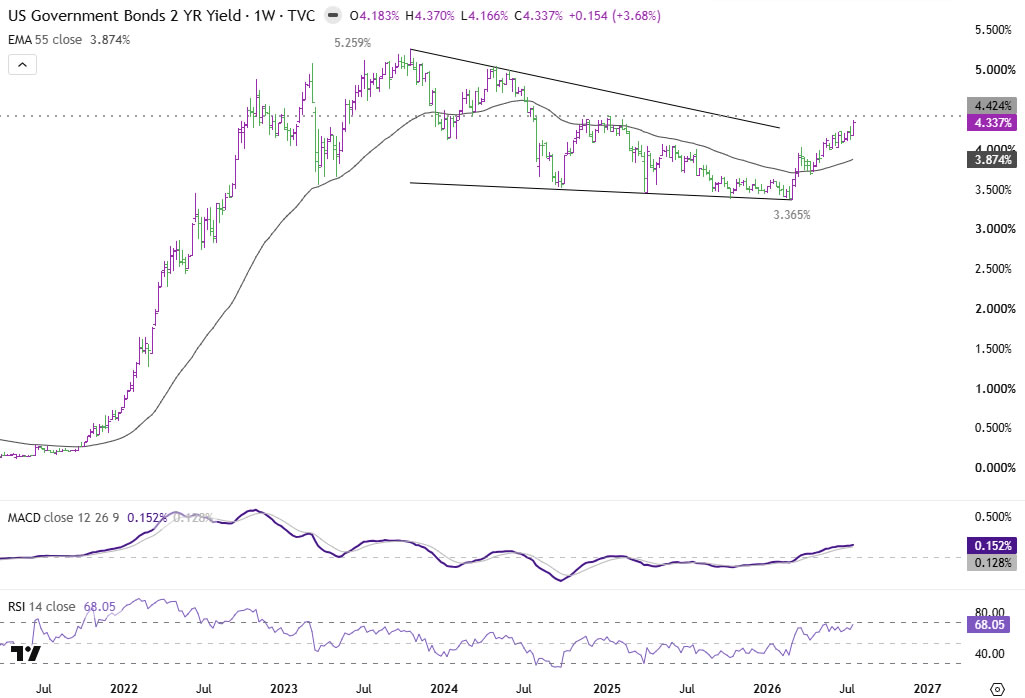
The 2-year Treasury yield, which closely tracks expectations for Fed policy, has regained upside momentum after rebounding from 3.365. Attention now turns to 4.424, the 2025 high. A decisive move above that level would strengthen the case that the correction from 5.259 (2023 high) has already concluded and shift focus back toward that peak. Such a development would imply markets increasingly expect more than a one-off response from the Fed, instead pricing a renewed tightening cycle driven by persistent energy-led inflation.
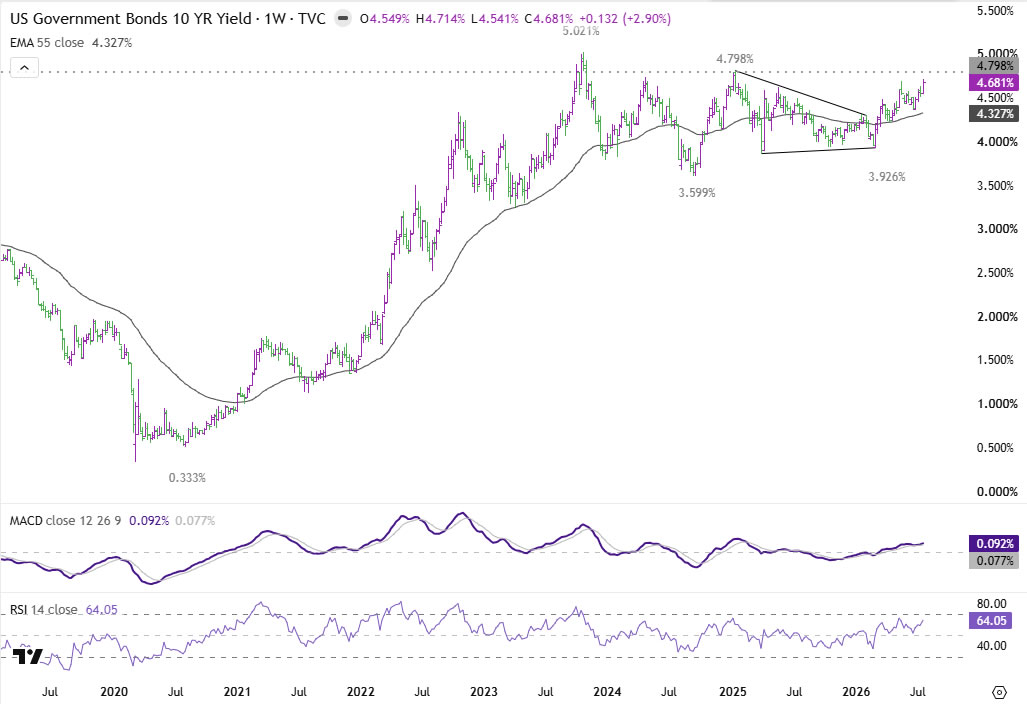
The 10-year Treasury yield tells a broader story. Beyond Fed expectations, it incorporates long-term inflation expectations, growth prospects and the additional compensation investors require to hold longer-duration securities. Having already resumed its advance from 3.926 and broken above 4.700, the next key hurdle stands at 4.798. A sustained break would bring the 2023 high at 5.021 back into view.
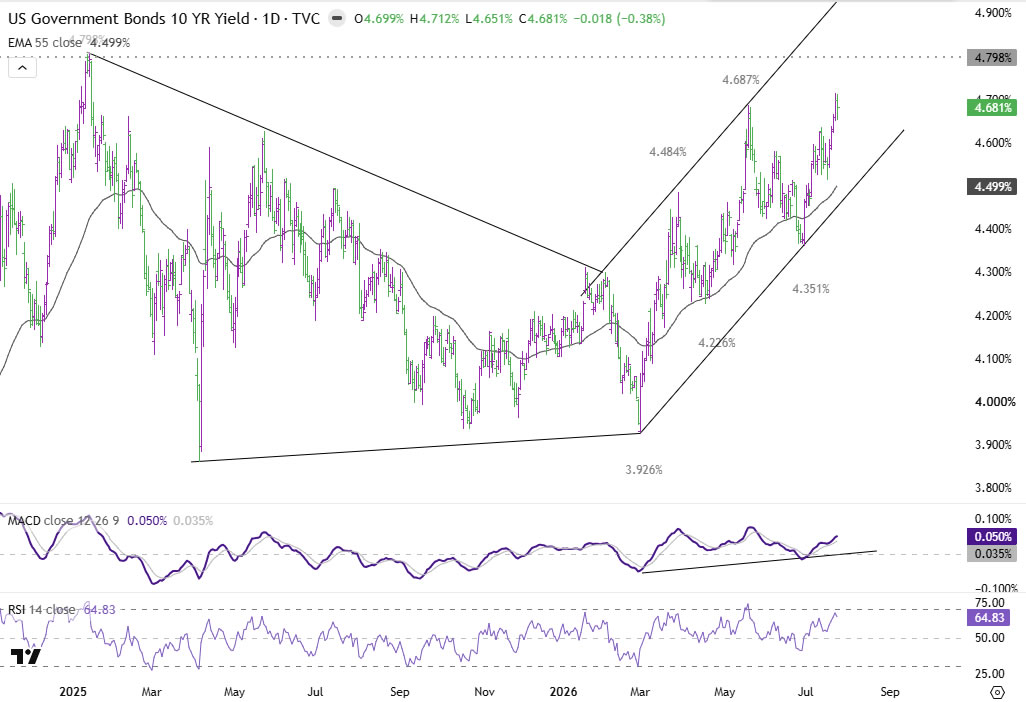
That level carries particular significance because it would suggest markets are demanding more than compensation for expected Fed tightening. A decisive move above 4.798 could indicate rising concern over inflation persistence, fiscal borrowing needs and geopolitical uncertainty, pushing the term premium higher. In other words, it would mark the transition from an orderly repricing of interest rates to a more profound reassessment of long-term risk—exactly the type of confirmation that would indicate the current oil shock is evolving into a broader market regime shift.
Equities: Watch Seoul Before Wall Street
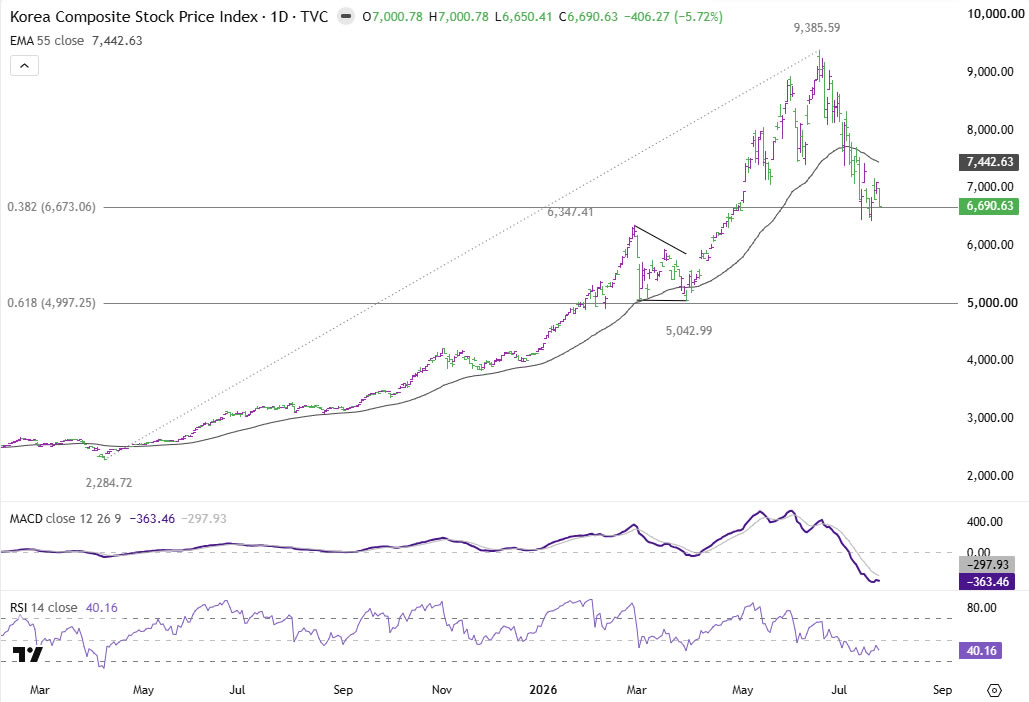
If the current supply shock begins to undermine global growth, the earliest signs may not emerge on Wall Street. Instead, investors should keep a close eye on South Korea, where equity markets are already under pressure and the economy remains highly exposed to imported energy. While US indices continue to trade relatively close to record highs, KOSPI has already entered a far more fragile technical position.
The contrast reflects important structural differences. US equities continue to receive support from AI-related capital expenditure and resilient domestic demand, cushioning the impact of higher oil prices. South Korea enjoys no such buffer. Its dependence on imported crude means rising energy costs feed more directly into corporate margins and the broader economy, while its export-oriented technology sector remains vulnerable to any deterioration in global demand. That combination makes KOSPI a more immediate barometer of whether supply disruptions are evolving into a wider macroeconomic shock.
Technically, KOSPI is testing a decisive medium-term support at 6,673.06, representing 38.2% retracement of the advance from 2,284.72 to 9,385.59. Sustained break would reinforce the view that the market has already entered a secular bear trend and expose 61.8% retracement at 4,997.25, close to the 5000 psychological level. Such a decline would likely raise concerns about broader contagion across Asian equity markets rather than remaining an isolated country-specific correction.
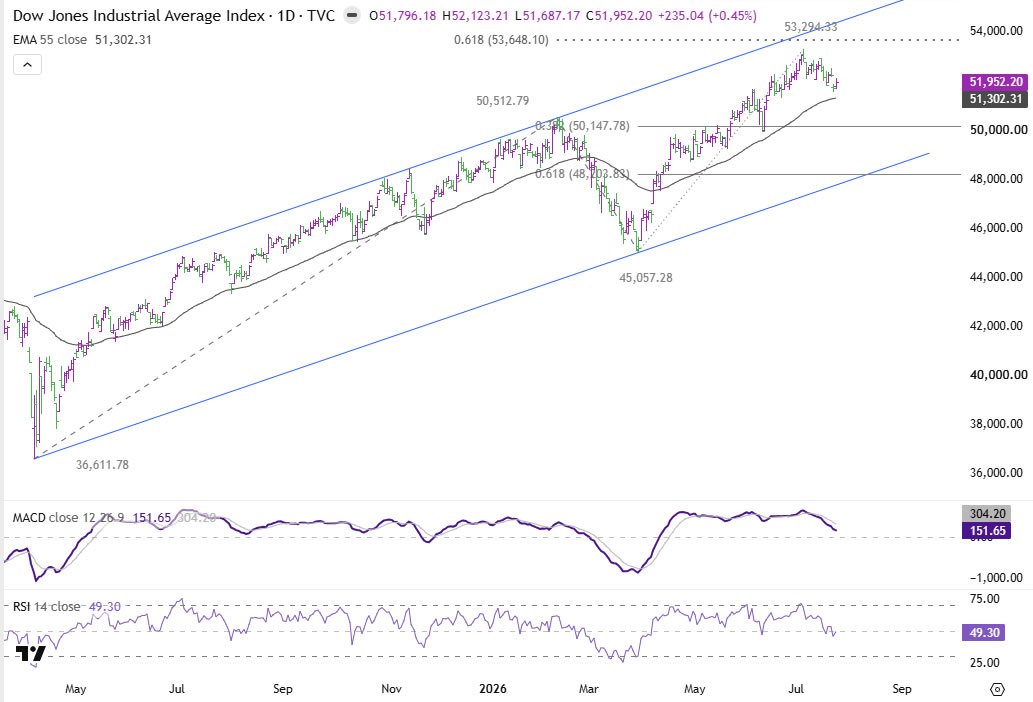
By contrast, DOW is only beginning to show signs of fatigue. Daily MACD continues to weaken after the record high at 53,294.33, suggesting a near-term top may already be in place. A break below the 55 D EMA at 51,302.31 would open the way toward 38.2% retracement of 45,057.28 to 53,294.33 at 50,147.78, while only a decisive move beneath 50000 would indicate investors are pricing a much more severe economic slowdown. Until those levels give way, KOSPI may prove to be the more reliable canary in the coal mine for the global implications of a second oil shock.
Dollar Index: Final Piece of the Puzzle
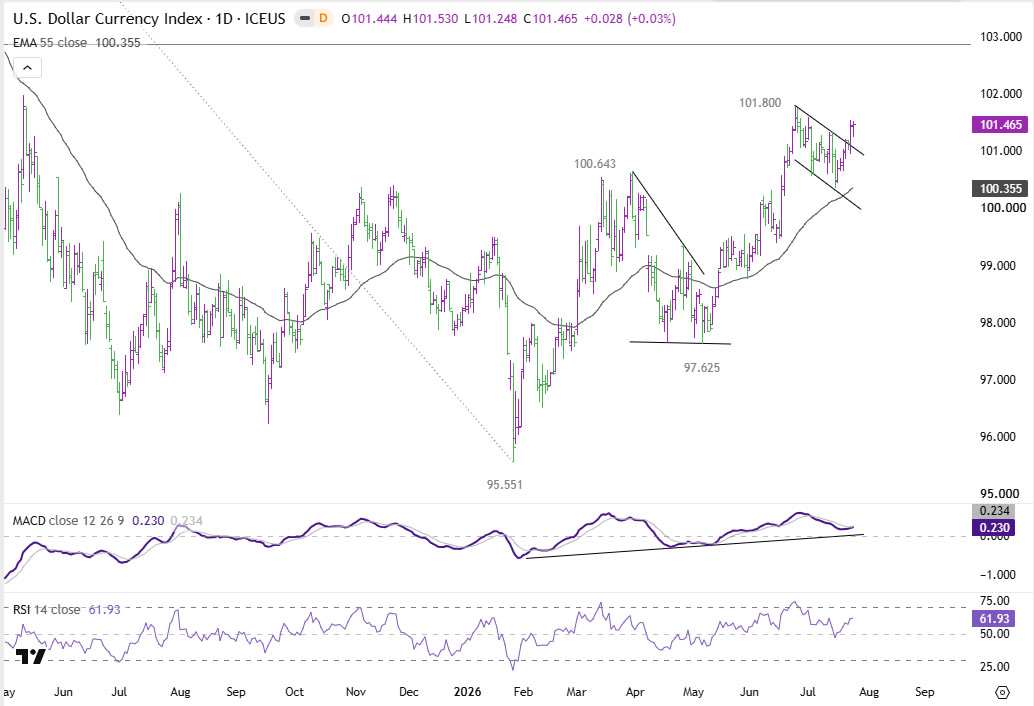
The Dollar has so far delivered a surprisingly restrained response to the latest surge in oil prices. Although Treasury yields have moved higher and geopolitical risks have intensified, Dollar Index continues to trade below near term resistance at 101.87. That suggests investors have yet to embrace either a classic safe-haven rush into US assets or a more aggressive repricing of Federal Reserve policy. For now, the market appears to view the current shock as significant but not yet severe enough to justify a decisive shift in global capital flows.
That hesitation is understandable. While higher oil prices generally support Dollar through stronger inflation expectations and higher US yields, they also raise downside risks to economic growth. Those opposing forces have kept DXY confined within its recent range, even as Brent climbed back to $100. The next directional move in the Dollar is therefore likely to depend less on geopolitical headlines than on whether oil-driven inflation begins feeding more convincingly into Treasury yields and Fed expectations.
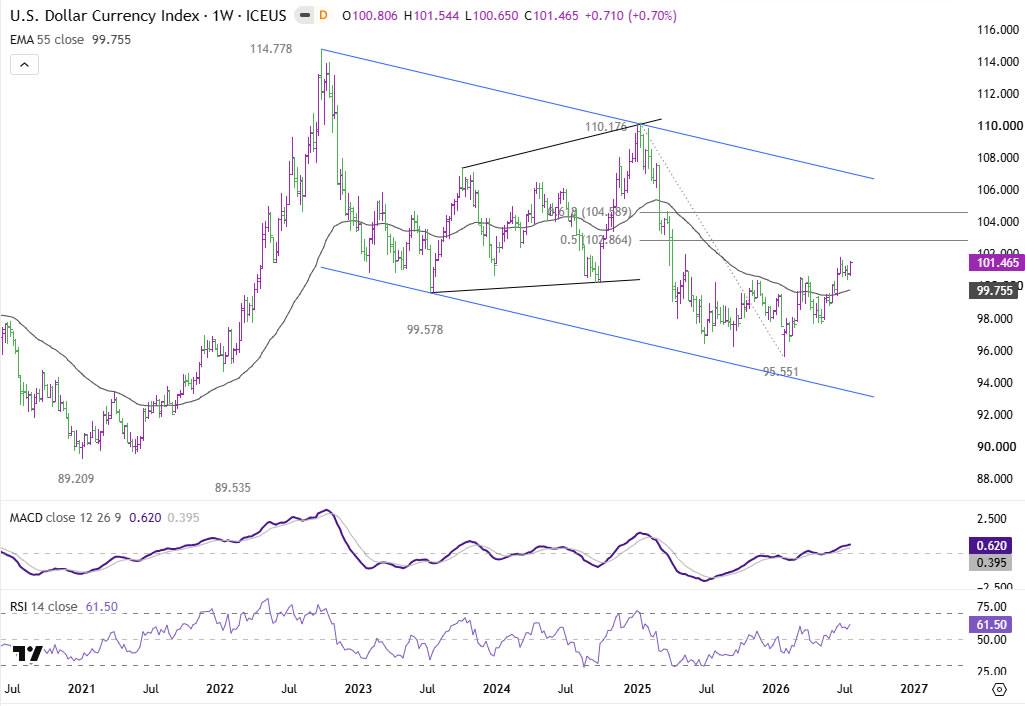
Technically, however, the near-term outlook remains constructive as long as the rising 55 D EMA, now at 100.35, continues to provide support. A firm break above 101.87 would resume the rebound from 95.55 to 50% retracement of 110.17 (2025 high) to 95.55 (2026 low) at 102.86. Such a move would suggest markets are beginning to treat the current supply shock as something more persistent than a temporary geopolitical disruption.
Further gains beyond 102.86 would carry broader macro implications. They would point to growing conviction that the Fed may need to tighten policy more aggressively to contain renewed inflation pressures, while also reflecting a stronger bid for Dollar amid deteriorating global risk sentiment.
In that scenario, attention would shift toward 61.8% retracement at 104.58 and, ultimately, channel resistance around 107. A synchronized breakout in Brent crude, Treasury yields and Dollar would provide compelling evidence that markets have entered a new stagflation-driven regime rather than simply reacting to another geopolitical flare-up.
Conclusion: Five Levels That Could Define Next Move
Last week’s surge in oil prices marked an important turning point, but not necessarily a decisive one. Markets are increasingly aware that risks to global energy supplies have broadened beyond a single conflict, with disruptions now threatening three critical shipping corridors at a time when inventories are already depleted. Yet awareness alone is not enough to trigger a full-scale repricing across financial markets.
The next stage will depend on confirmation. Brent crude has taken the lead, but Treasury yields, Dollar and global equities have yet to cross the technical and psychological thresholds that would signal investors are preparing for a more persistent inflation shock and a more aggressive Federal Reserve response. Whether those markets follow oil higher may prove more important than geopolitical headlines themselves.
In that sense, this week’s five indicators provide a practical framework rather than merely a collection of charts. If Brent extends its breakout, Treasury yields clear their 2025 highs, KOSPI loses critical support and Dollar Index finally escapes its consolidation, the evidence would increasingly point to a new macro regime driven by energy supply constraints rather than temporary geopolitical uncertainty. If those levels continue to hold, however, the latest rally in oil may ultimately prove to be another risk premium rather than the beginning of a second global oil shock.
EUR/USD Weekly Outlook
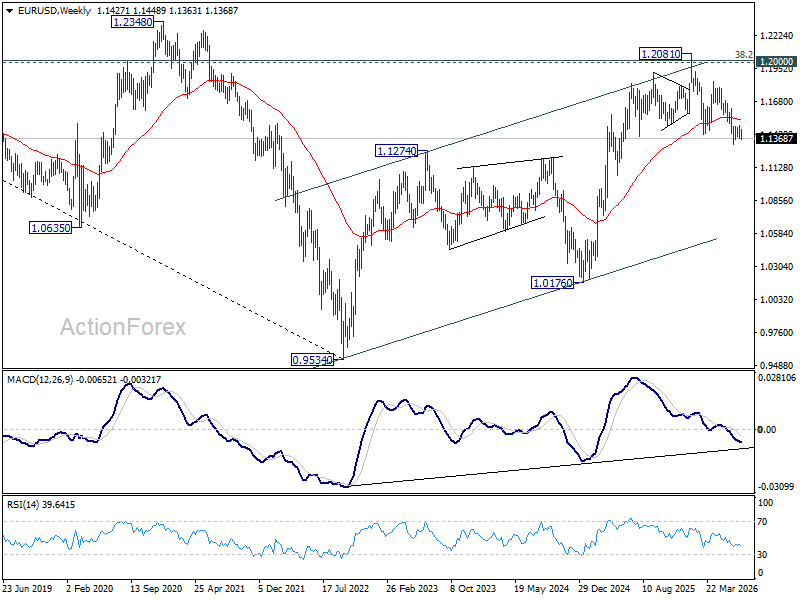
EUR/USD stayed in consolidations above 1.1323 last week and outlook is unchanged. Initial bias remains neutral this week first. Outlook stays bearish with 11499 support turned resistance intact. On the downside, break of 1.1323 will resume the fall from 1.2081 to 100% projection of 1.2081 to 1.1408 from 1.1848 at 1.1175. However, decisive break of 1.1499 will turn bias back to the upside for 1.1621 resistance.
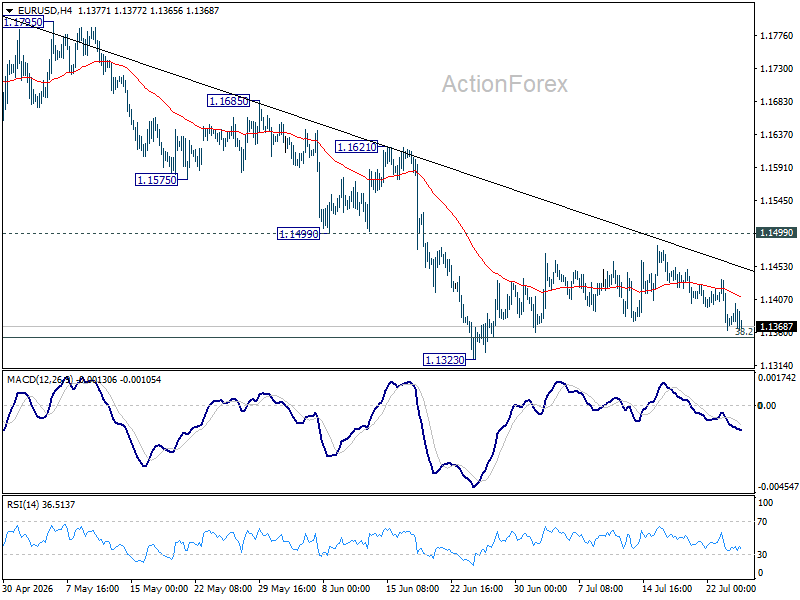
In the bigger picture, focus is back on 38.2% retracement of 1.0176 to 1.2081 at 1.1353. Decisive break there will revive the case of medium term bearish trend reversal after rejection by 1.2 key cluster resistance level. Further fall should be seen to 61.8% retracement at 1.0904. Nevertheless, strong rebound from 1.1353, followed by break of 1.1621 resistance, will retain medium term bullishness.
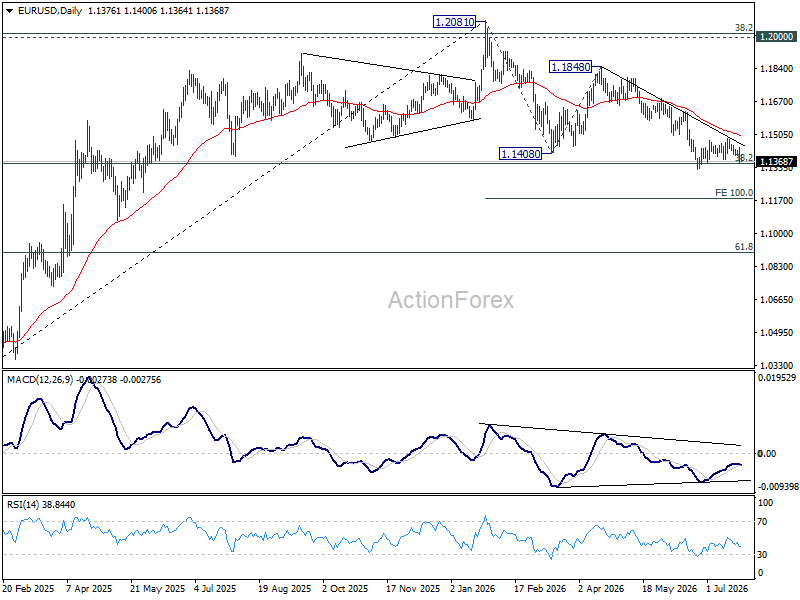
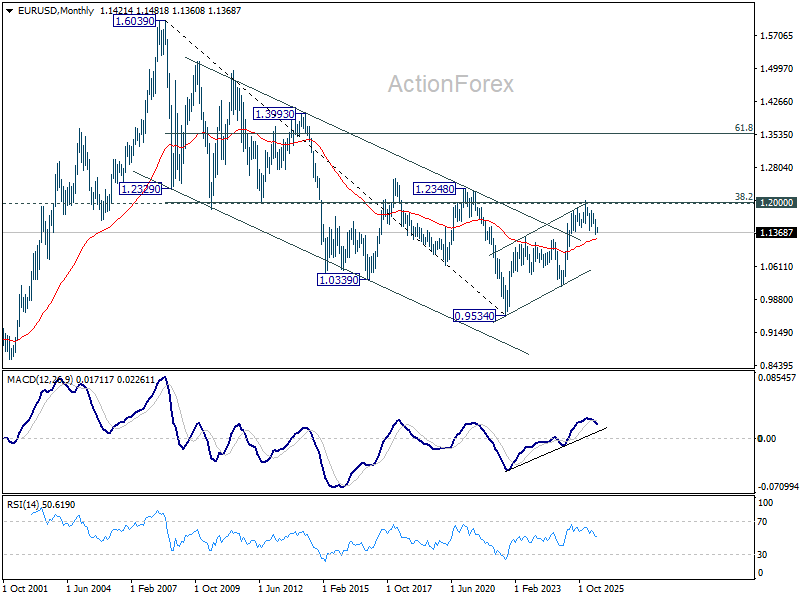
In the long term picture, 38.2% retracement of 1.6039 to 0.9534 at 1.2019, which is close to 1.2000 psychological level is the key for the outlook. Rejection by this level will keep the multi decade down trend from 1.6039 (2008 high) intact, and keep outlook neutral at best. However, decisive break of 1.2000/19, will suggest long term bullish trend reversal, and target 61.8% retracement at 1.3554.