
The EUR/USD currency pair
Technical indicators of the currency pair:
Prev Open: 1.12533
Open: 1.12662
% chg. over the last day: +0.15
Day’s range: 1.12621– 1.12747
52 wk range: 1.1111 – 1.2090
Last week, the US dollar came under pressure after the dovish comments by the Fed Chairman. At the moment, the EUR/USD currency pair is in a sideways movement. Unidirectional trend is not observed. The trading instrument tests local support and resistance levels: 1.12500 and 1.12800, respectively. Financial market participants expect additional drivers. We recommend to open positions from key levels.
The Economic News Feed for 15.07.2019 is calm.
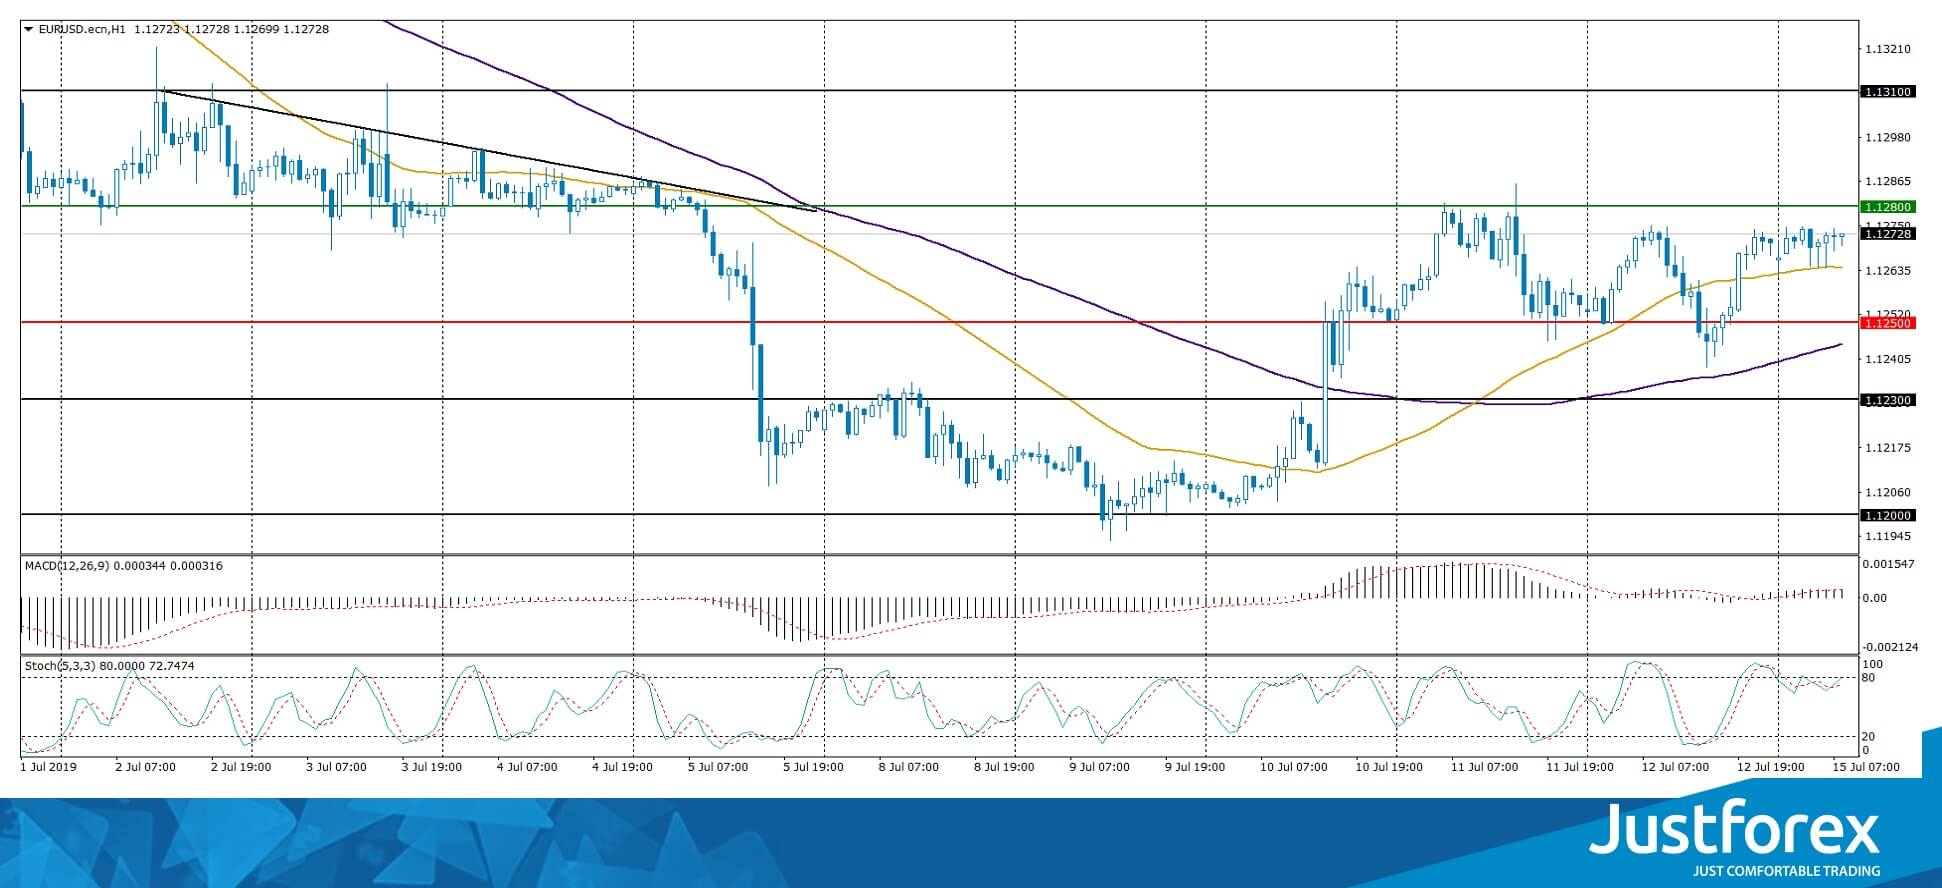
The price has fixed above 50 MA and 100 MA, which indicates the strength of buyers.
The MACD histogram is in the positive zone and continues to rise, which signals bullish moods.
The Stochastic Oscillator is located near the overbought zone, the %K line is above the %D line, which gives a weak signal to buy EUR/USD.
Trading recommendations
Support levels: 1.12500, 1.12300, 1.12000
Resistance levels: 1.12800, 1.13100, 1.13500
If the price consolidates above 1.12800, expect further growth to 1.13100-1.13400.
Alternatively, the quotes can drop to 1.12200-1.12000.
The GBP/USD currency pair
Technical indicators of the currency pair:
Prev Open: 1.25234
Open: 1.25495
% chg. over the last day: +0.43
Day’s range: 1.25478 – 1.25778
52 wk range: 1.2438 – 1.3631
GBP/USD retreated from annual lows and updated the local maximums. This was largely caused by the technical factors. Investors began to partially fix positions on the pound after a long fall. At the moment, GBP/USD quotes are consolidating. The key range is 1.25400-1.25800. The trading instrument has the potential for further correction. We recommend to keep up to date information on Brexit. Positions must be opened from key levels.
The Economic News Feed for 15.07.2019 is calm.
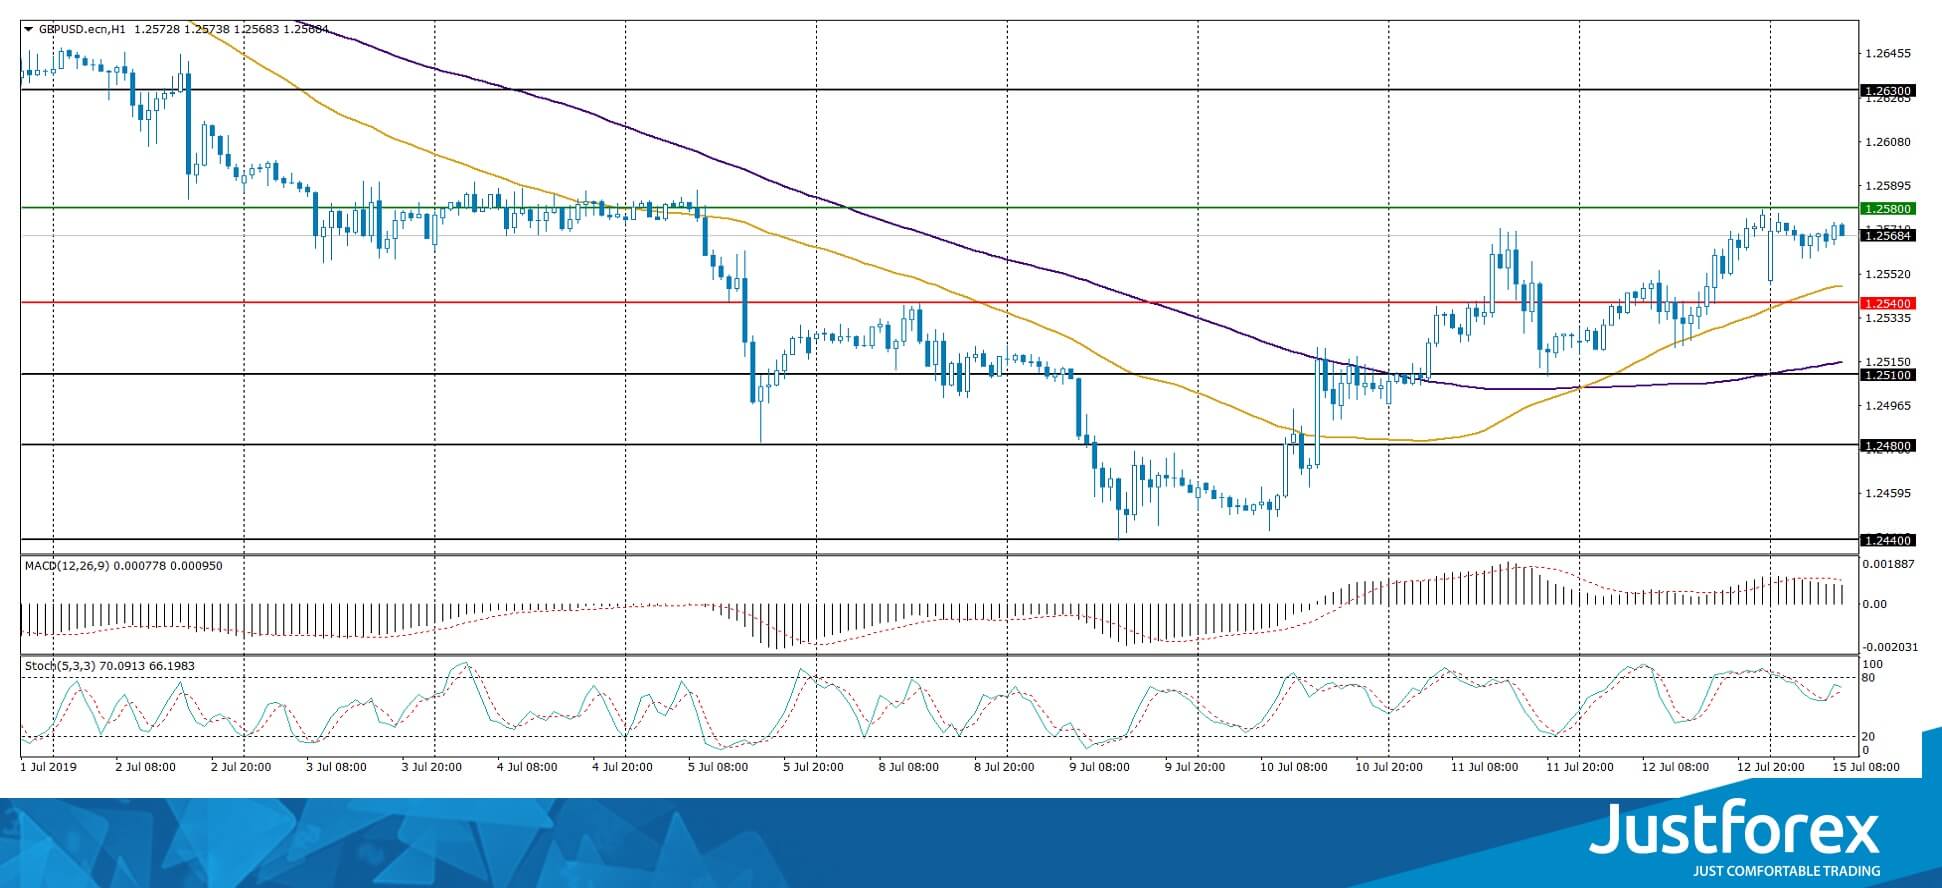
The price has fixed above 50 MA and 100 MA, which indicates the strength of buyers.
The MACD histogram is in the positive zone, but below the signal line, which gives a weak signal to buy GBP/USD.
The Stochastic Oscillator is in the neutral zone, the %K line has started to cross the %D line. There are no signals at the moment.
Trading recommendations
Support levels: 1.25400, 1.25100, 1.24800
Resistance levels: 1.25800, 1.26300
If the price consolidates above 1.25800, the quotes will ascend to 1.26200-1.26400.
Alternatively, the quotes can correct to 1.25100-1.24800.
The USD/CAD currency pair
Technical indicators of the currency pair:
Prev Open: 1.30699
Open: 1.30312
% chg. over the last day: -0.33
Day’s range: 1.30255 – 1.30429
52 wk range: 1.2727 – 1.3664
The bearish mood prevails on the USD/CAD currency pair. At the moment, the trading tool is testing key extremes. USD/CAD quotes are consolidating near the local support level of 1.30200. 1.30500 is already a “mirror” resistance. Trading instrument can decline further. We recommend to pay attention to the oil quotes dynamics. You should open positions from key levels.
The Economic News Feed for 15.07.2019 is calm.
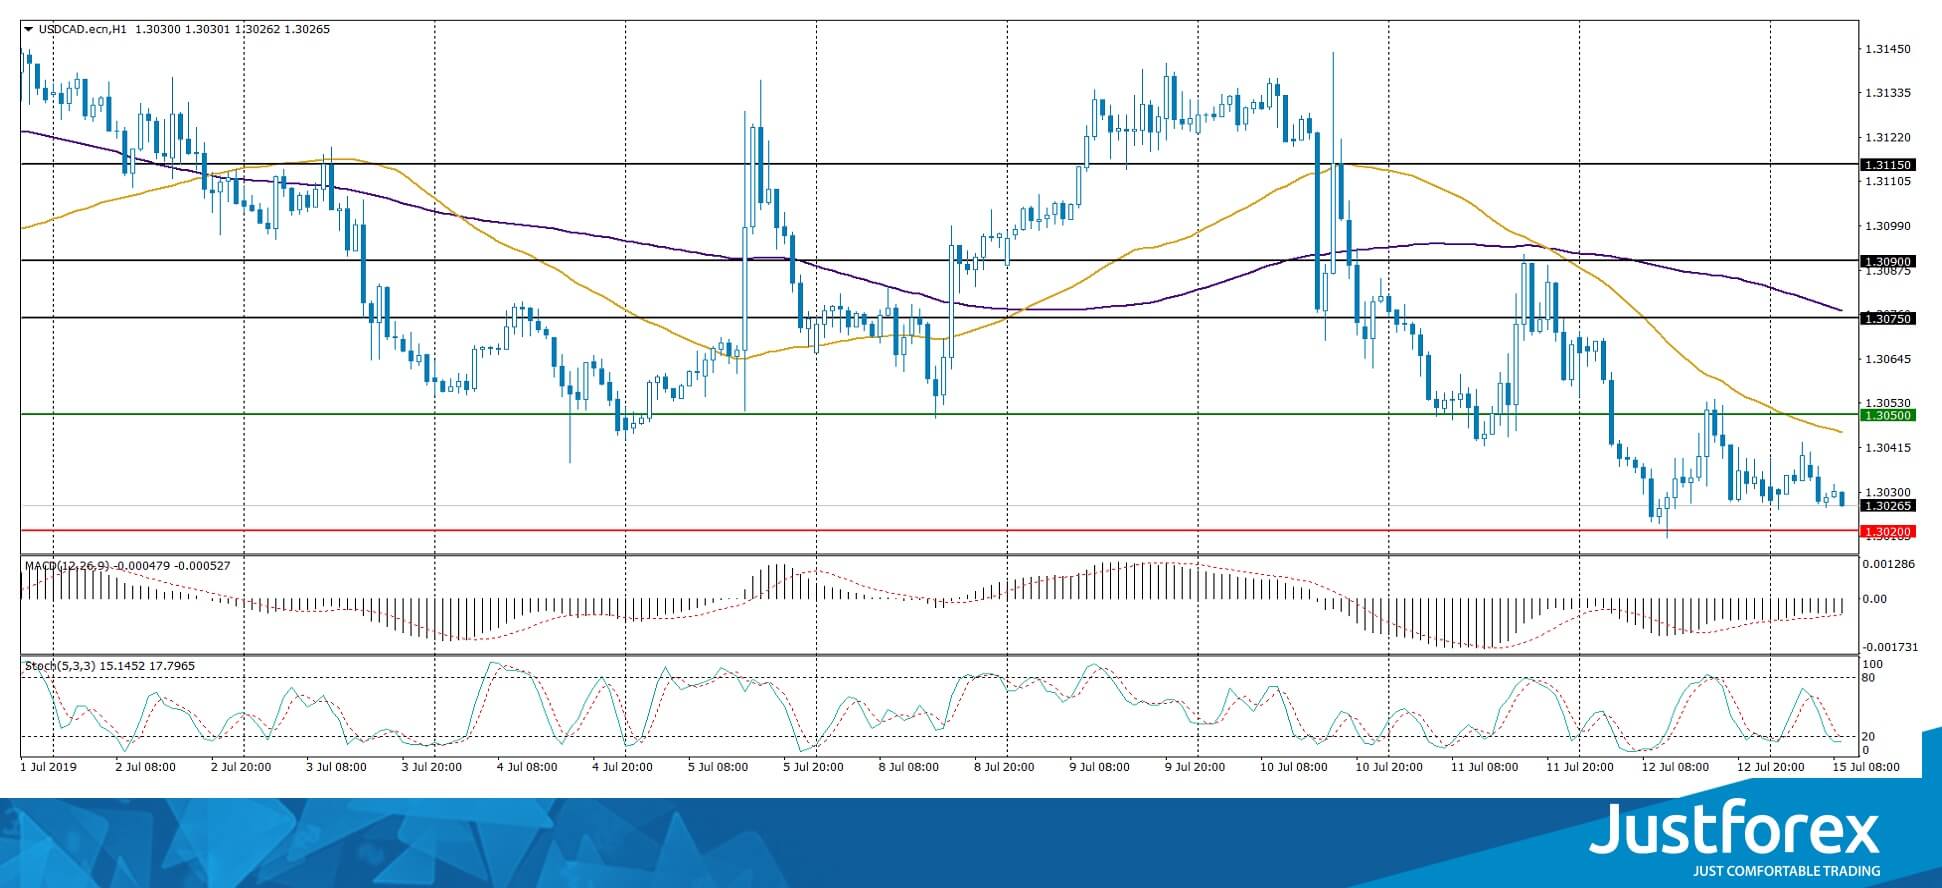
The price has fixed below 50 MA and 100 MA, which indicates the strength of the sellers.
The MACD histogram is in the negative zone and continues to decline, which gives a strong signal to sell USD/CAD.
The Stochastic Oscillator is in the oversold zone, the %K line is below the %D line, which also indicates bearish moods.
Trading recommendations
Support levels: 1.30200, 1.30000, 1.29750
Resistance levels: 1.30500, 1.30750, 1.30900
If the price consolidates below 1.30200, expect a descend toward 1.30000-1.29750.
Alternatively, the quotes can grow to 1.30700-1.30900.
The USD/JPY currency pair
Technical indicators of the currency pair:
Prev Open: 108.489
Open: 107.854
% chg. over the last day: -0.54
Day’s range: 107.798 – 108.109
52 wk range: 104.97 – 114.56
The USD/JPY currency pair stabilized after a sharp decline at the end of last week. At the moment the trading instrument is consolidating. Local levels of support and resistance are 107.800 and 108.100. The USD/JPY currency pair can decline further. We recommend to pay attention to the US Treasury bonds’ yield dynamics. Positions must be opened from key levels.
Japanese markets are closed due to the holiday.
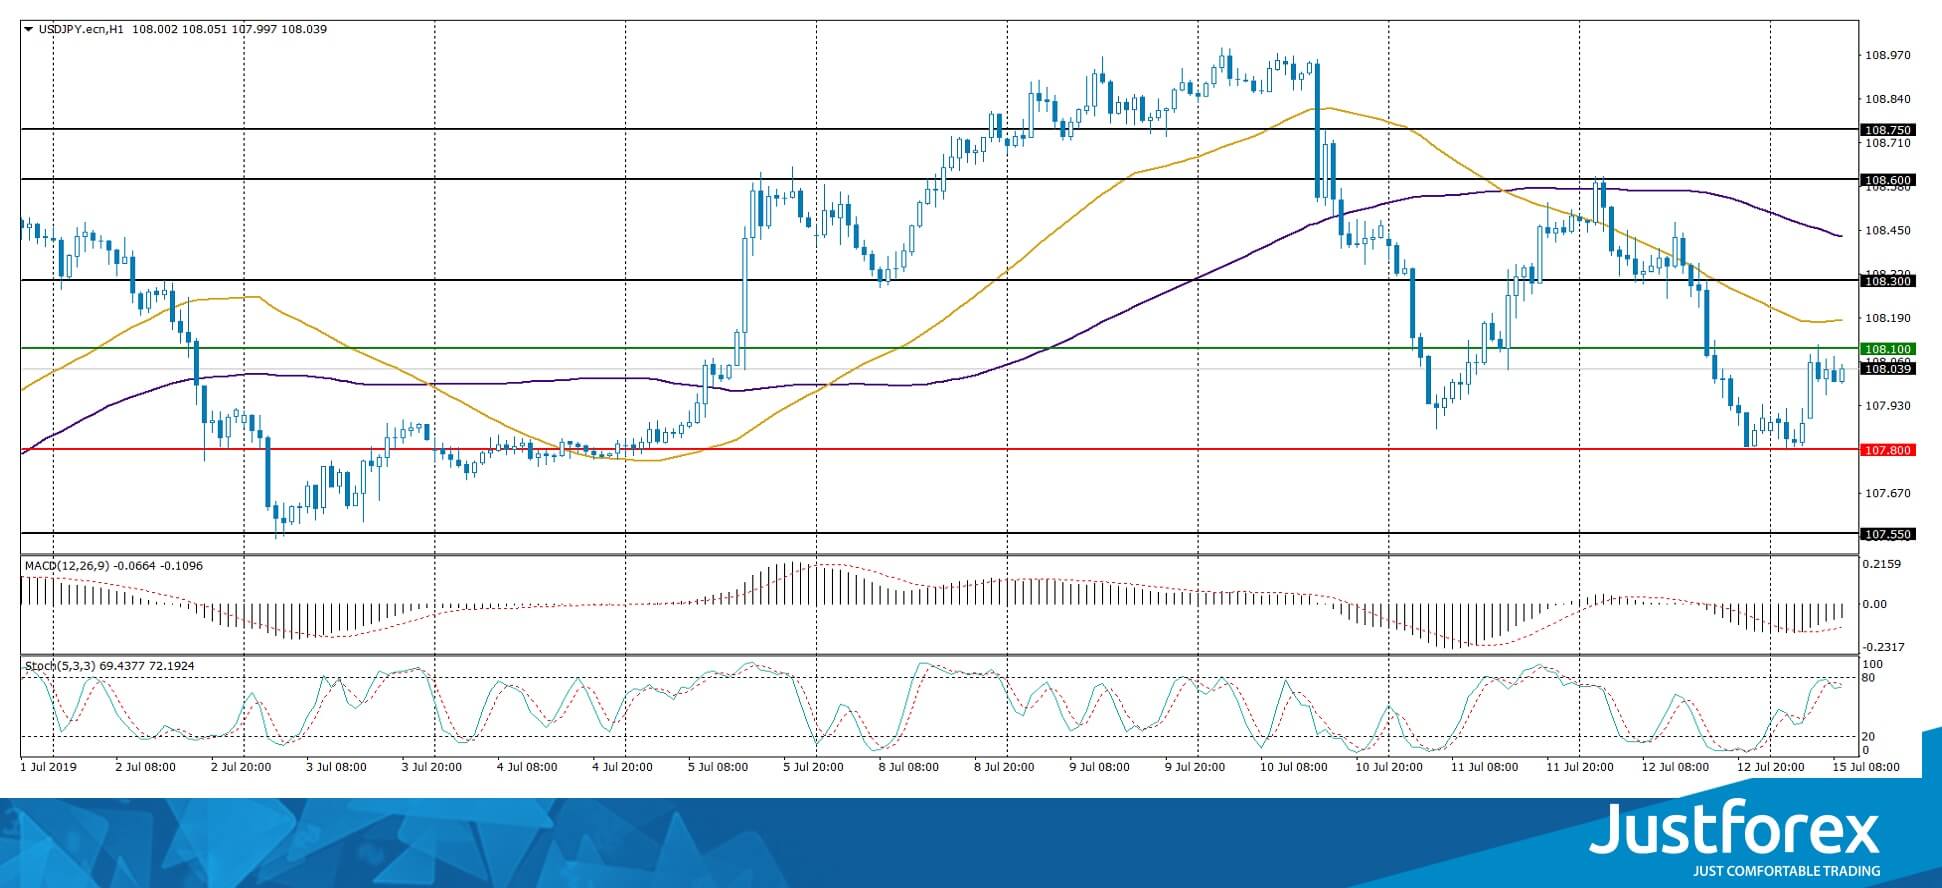
The price has fixed below 50 MA and 100 MA, which indicates the strength of the sellers.
The MACD histogram is in the negative zone, but above the signal line, which gives a weak signal to sell USD/JPY.
Stochastic Oscillator is in the neutral zone, the %K line crossed the %D line. There are no signals at the moment.
Trading recommendations
Support levels: 107.800, 107.550
Resistance levels: 108.100, 108.300, 108.600
If the price consolidates below 107.800, expect further descend toward 107.550-107.400.
Alternatively, the quotes can grow to 108.400-108.600.


