
Key Highlights
- Gold price struggled to climb above $1,520 and declined recently against the US Dollar.
- There was a break below a major bullish trend line with support near $1,490 on the 4-hours chart of XAU/USD.
- The US Pending Home Sales increased 1.5% in Sep 2019 (MoM), more than the +0.9% forecast.
- The US GDP is likely to grow 1.7% in Q3 2019 (Preliminary), down from the last 2.0%.
Gold Price Technical Analysis
This past week, gold price climbed higher above the $1,500 and $1,510 levels against the US Dollar. However, the price struggled to gain strength above $1,520 and recently started a fresh decline.
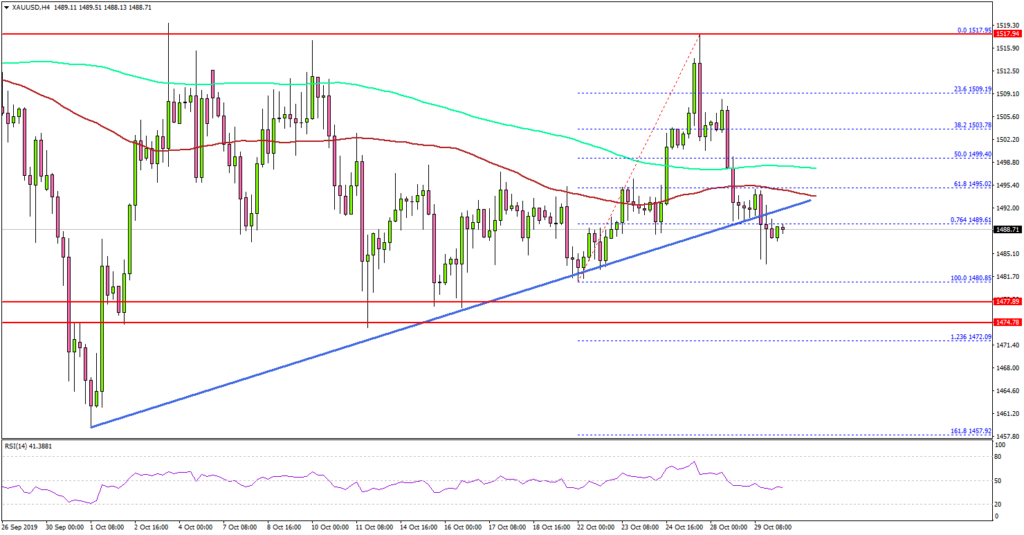
The 4-hours chart of XAU/USD indicates that the price failed to stay above the $1,515 pivot level. It declined below the $1,500 support level. Moreover, there was a break below the 50% Fib retracement level of the upward move from the $1,480 low to $1,517 high.
More importantly, the price traded below the $1,495 support and the 100 simple moving average (4-hours, red). Finally, there was a break below a major bullish trend line with support near $1,490 on the same chart.
If the price continues to slide, it could revisit the $1,480 and $1,475 support levels. On the upside, the $1,500 level may perhaps prevent a fresh increase along with the 100 SMA.
Fundamentally, the US Pending Home Sales report for Sep 2019 was released by the National Association of Realtors. The market was looking for a 0.9% rise in sales compared with the previous month.
The actual result was better than the forecast, as there was a 1.5% increase in sales in Sep 2019. Looking at the yearly change, there was a 3.9% rise in sales, up 1.4% from Sep 2018.
The report added:
The PHSI in the Northeast fell 0.4% to 93.9 in September, but is still 1.3% higher than a year ago. Pending home sales in the South increased 2.6% to an index of 127.5 in September, a 5.7% jump from last September. The index in the West declined 1.3% in September 2019 to 95.1, which is an increase of 3.4% from a year ago.
Looking at EUR/USD, the pair is trading nicely above the 1.1050 and 1.1070 support levels. Besides, GBP/USD is climbing higher once again towards 1.2950.
Economic Releases to Watch Today
- US ADP Employment Change Oct 2019 – Forecast 120K, versus 135K previous.
- US Gross Domestic Product Q3 2019 (Preliminary) – Forecast 1.7% versus previous 2.0%.
- BoC Interest Rate Decision – Forecast 1.75%, versus 1.75% previous.
- Fed Interest Rate Decision – Forecast 1.75%, versus 2.0% previous.


