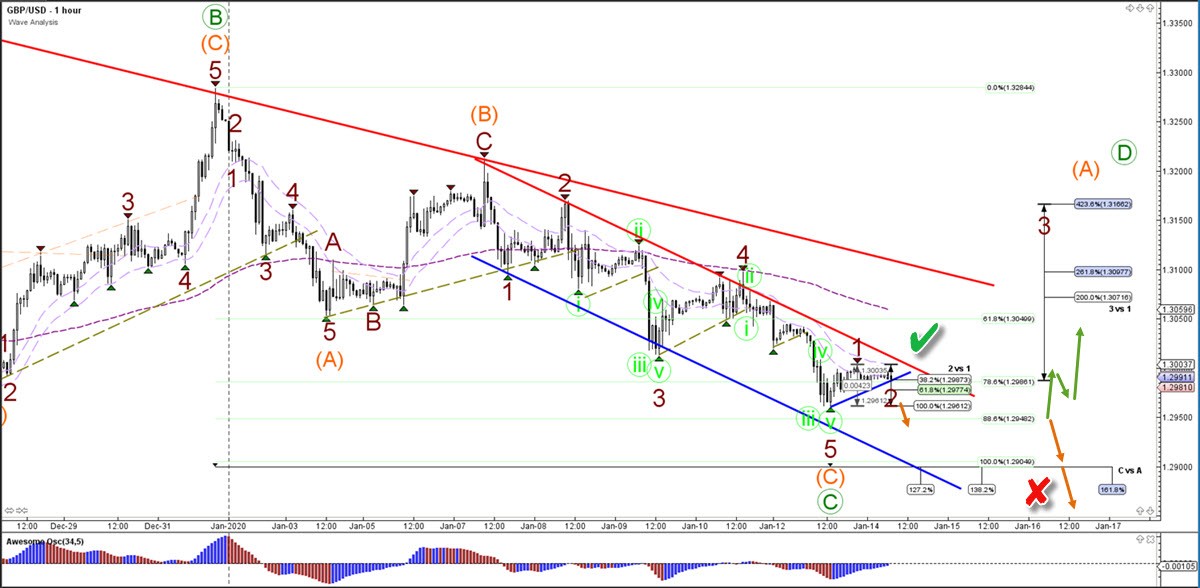
The GBP/USD breakout below the 100% Fibonacci level and bottom of wave A (green) invalidates (red x) the expected triangle chart pattern and could indicate a bearish ABC zigzag pattern. A bullish bounce, however, could confirm (green check) the triangle and indicate a 3 wave up within the expected wave D (green).
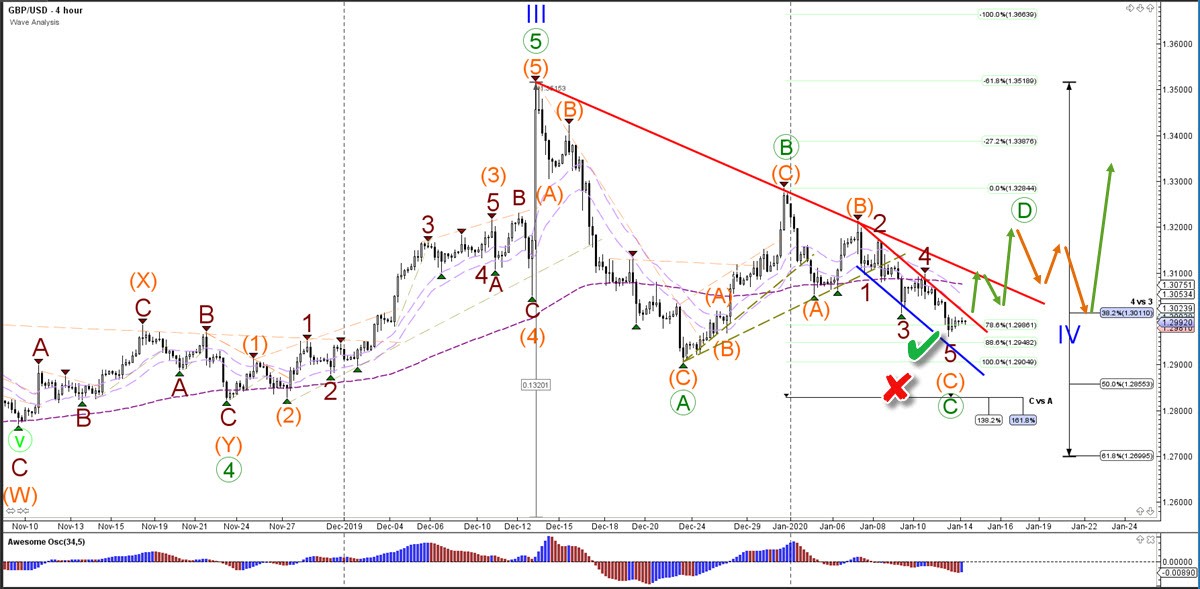
The GBP/USD needs to stay above the 88.6% Fibonacci retracement level to keep the triangle pattern as the most likely scenario. A break below the 88.6% Fib makes the triangle less likely and a push below the 100% level fully invalidates it. A bullish ABC (orange) pattern could take place within wave D (green).