
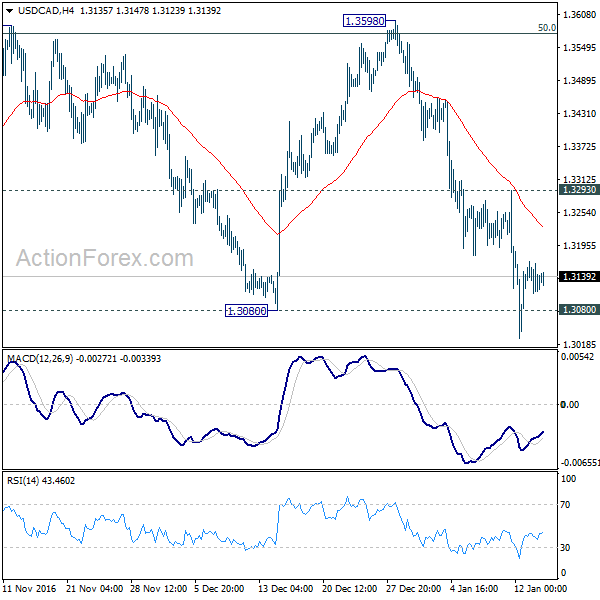
Daily Pivots: (S1) 1.3092; (P) 1.3129; (R1) 1.3151; More…
Deeper decline is expected in USD/CAD as long as 1.3293 resistance holds. As noted before, prior break of 1.3080 key support level could have completed a double top pattern (1.3588, 1.3598) and indicates reversal. That is, whole corrective rise from 1.2460 is finished. Deeper decline should be seen to retest 1.2460 low. However, break of 1.3293 will invalidate this bearish case and turn bias to the upside for retesting 1.3598.
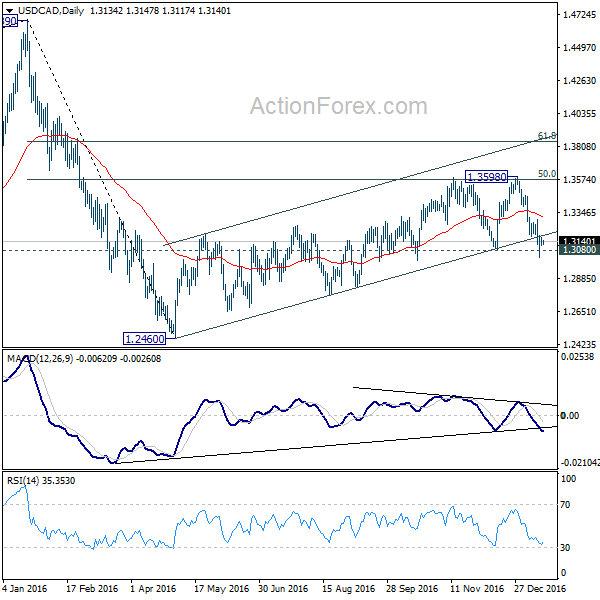
In the bigger picture, price actions from 1.4689 medium term top are seen as a correction pattern. The first leg has completed at 1.2460. The second leg is likely finished at 1.3598 too after hitting 50% retracement of 1.4689 to 1.2460 at 1.3575. Break of 1.3080 would now likely resume the fall from 1.4689 through 1.2460 to 50% retracement of 0.9406 to 1.4689 at 1.2048. We’d start to look for reversal signal below 1.2460 again to complete the correction. In case of another rise, we’ll look for topping sign at 61.8% retracement of 1.4689 to 1.2460 at 1.3838.
Subscribe to our daily and mid-day newsletter to get this report delivered to your mail box


