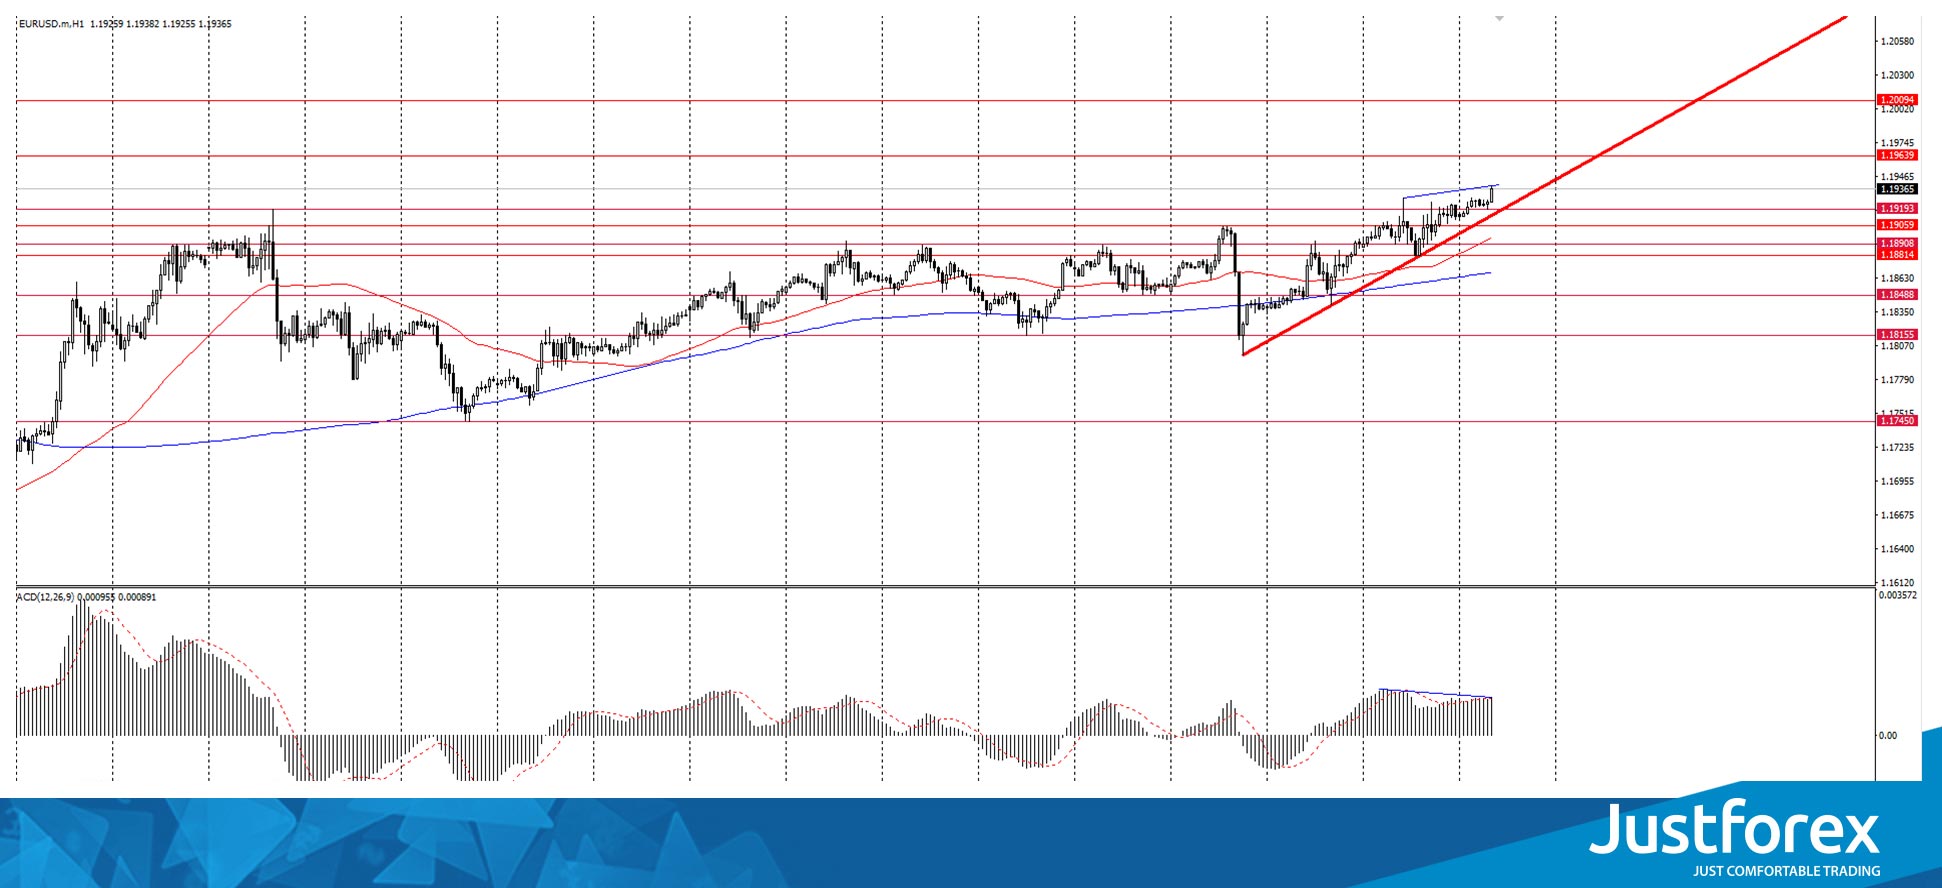
The EUR/USD currency pair
Technical indicators of the currency pair:
Prev Open: 1.1888
Prev Close: 1.1913
% chg. over the last day: +0.21%
Yesterday, the EUR/USD currency pair was traded in an uptrend and showed +0.21%. An uptrend is observed on the chart, which indicates the predominance of purchases on this asset. On the hourly timeframe, the price is being traded above the moving average MA 200. On the H4 timeframe, the situation is similar. The MACD indicator is in the positive zone. Based on the above, it is worth considering buy positions while the price is above MA200 on H1.
Trading recommendations
Support levels: 1.1920, 1.1905, 1.1890, 1.1881, 1.1848, 1.1815
Resistance levels: 1.1963, 1.2000
The main scenario for trading EUR/USD is looking for buy entry points. The price broke through 1.1920 and fixed above it. We recommend considering entry points on correction on lower timeframes. It is worth paying attention to the divergence on H1. This may signal that the currency pair will be correcting. At the moment, the main target for the pair is 1.1963.
Alternative scenario: if the price fixes below the level of 1.1905 on the H1 timeframe and below the MA200 on the H1, the currency pair is likely to decline to the level of 1.1881.
News feed for 2020.11.26:
- Thanksgiving Day in the US;
- Publication of the ECB monetary policy meeting account at 13:30 (GMT+2);
- ECB monetary policy statement at 14:30 (GMT+2).
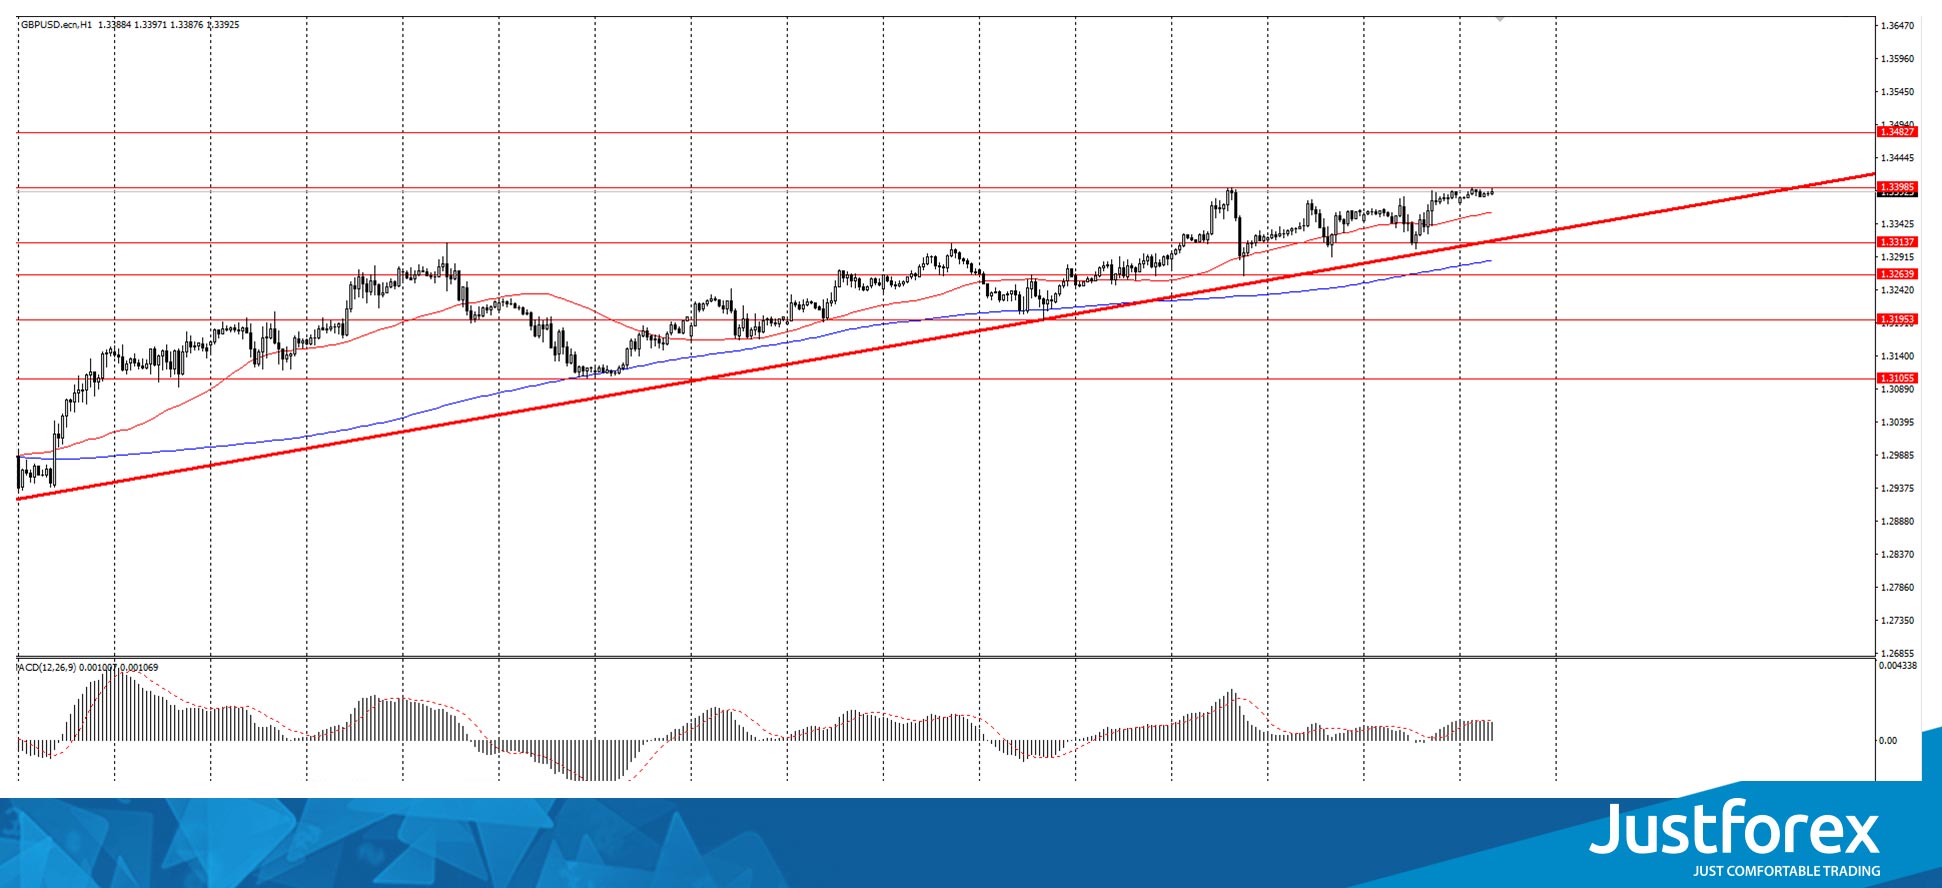
The GBP/USD currency pair
Technical indicators of the currency pair:
Prev Open: 1.3347
Prev Close: 1.3386
% chg. over the last day: +0.29%
Yesterday, the GBP/USD pair was traded in an uptrend and showed +0.29%. On the hourly chart, GBP/USD is being traded above the moving average MA (200) H1. The situation is similar on the four-hour chart. The MACD indicator is in the positive zone. There is still an uptrend. Based on the above, it is necessary to look for buy entry points while the pair remains above MA 200 H1.
Trading recommendations
Support levels: 1.3314, 1.3263, 1.3195, 1.3105
Resistance levels: 1.3398, 1.3482
The main scenario: look for buy entry points. If the price breaks through the level of 1.3398 and fixes above it, the quotes may move to the level of 1.3482. It is also worth noting that divergence is drawn on the MACD on the H4 timeframe. This may signal the beginning of a pair correction.
Alternative scenario: if the price fixes below 1.3314, then the asset may fall to $1.3195.
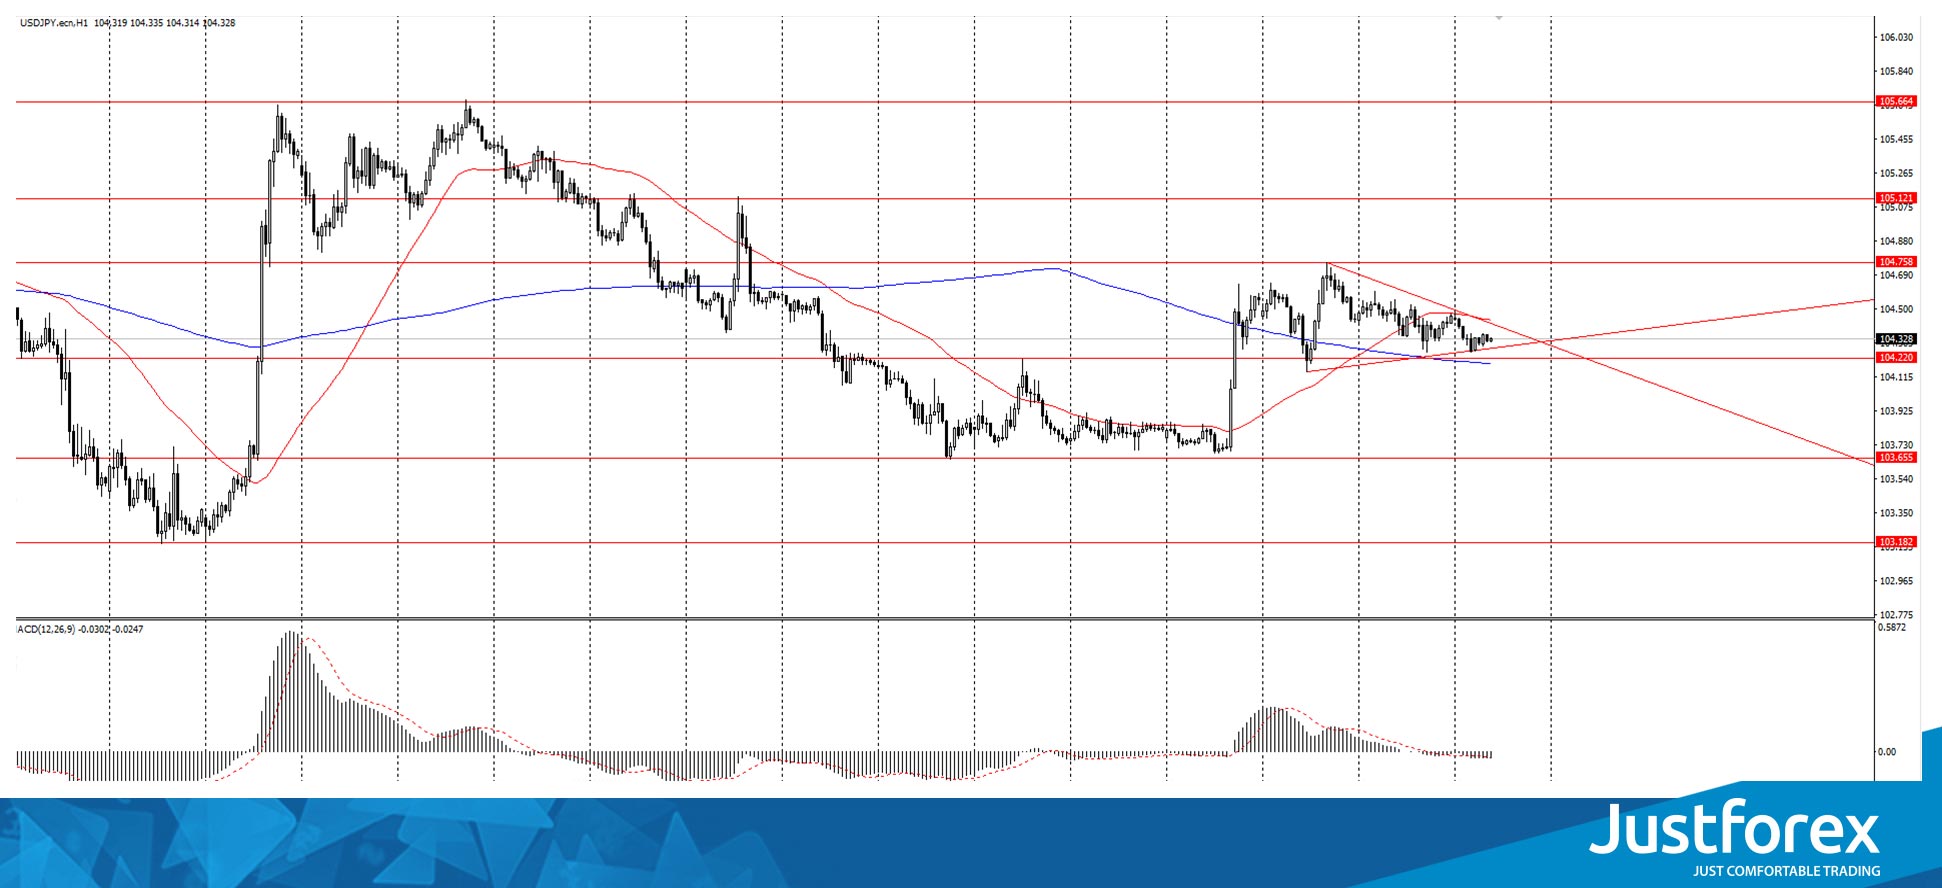
The USD/JPY currency pair
Technical indicators of the currency pair:
Prev Open: 104.43
Prev Close: 104.45
% chg. over the last day: 0%
Yesterday, the USD/JPY currency pair was traded in the range of 104.25-104.60 and closed with 0%. USD/JPY is drawing an ascending triangle on H1. On the hourly chart, the currency pair has fixed above the moving average MA (200). On the four-hour chart, the price is below MA200. MACD indicator on H1 is in the negative zone. Based on the above, one should try to look for buy entry points, but be careful and monitor the situation when the price approaches the moving average MA 200 on the H4 timeframe.
Trading recommendations
Support levels: 104.22, 103.65
Resistance levels: 104.75, 105.12
The main scenario: consider buying an asset. You can try to trade triangle technical analysis figure. If the price breaks through the upper border of the triangle and fixes above it, the price may move to 104.75.
An alternative scenario assumes consolidation below the level of 104.22 with a further fall to 103.65.
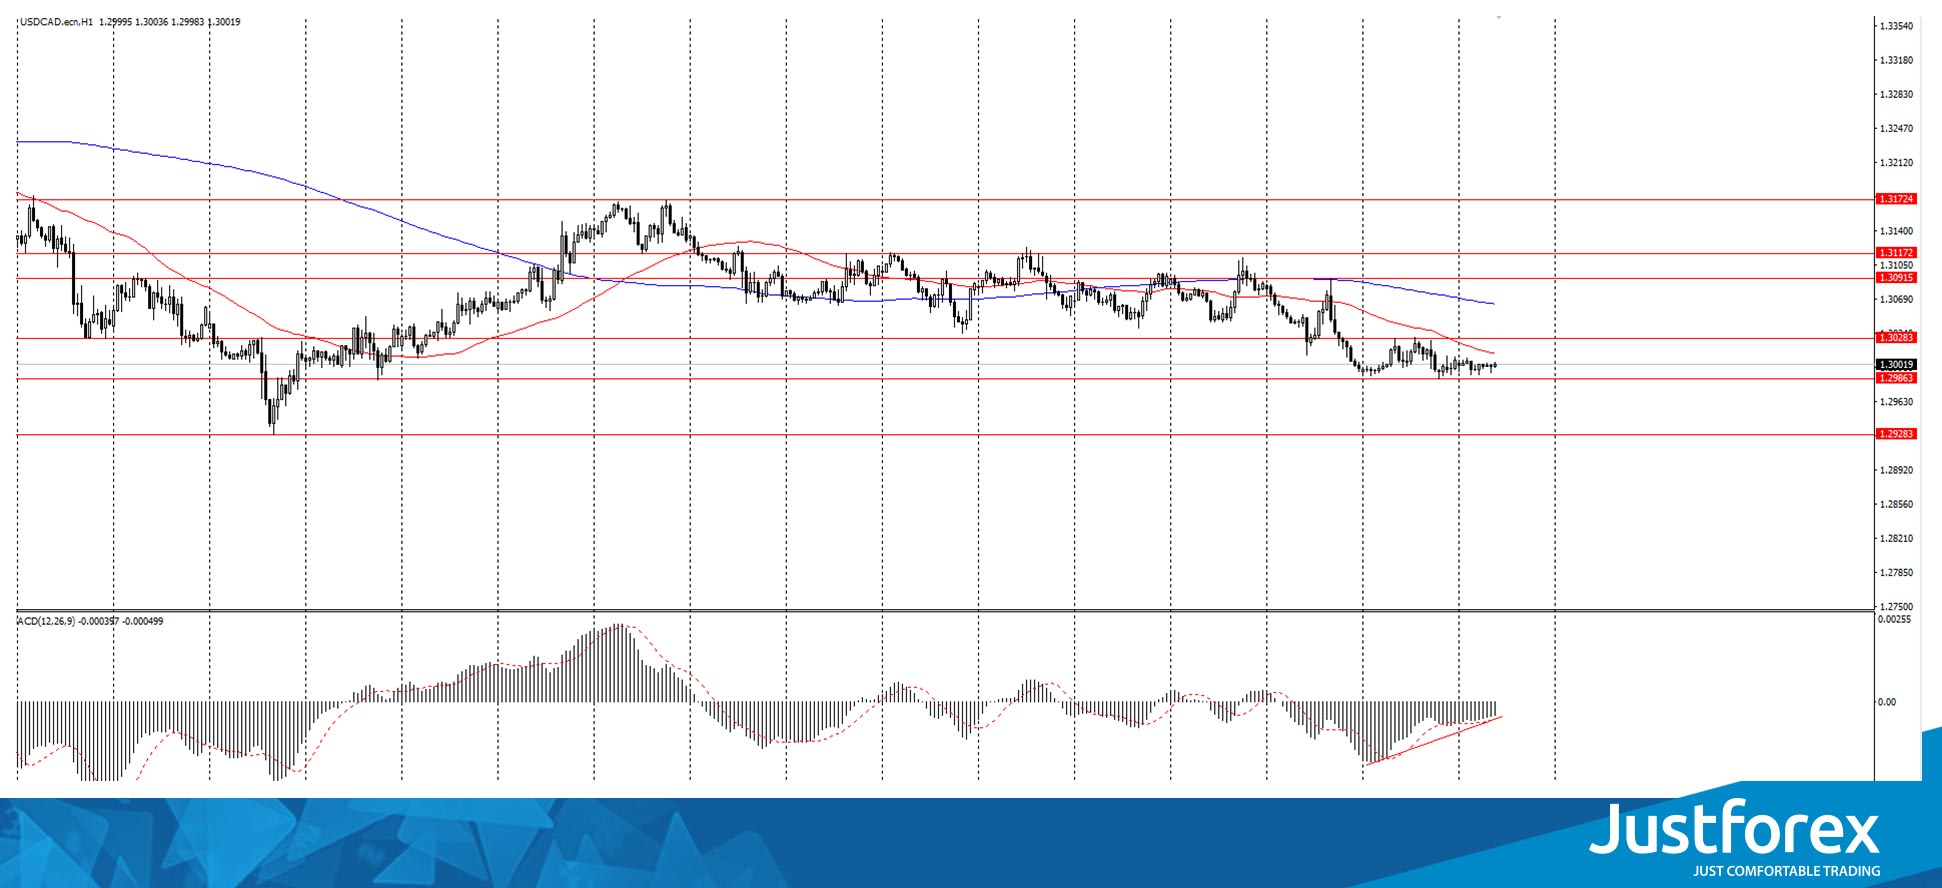
The USD/CAD currency pair
Technical indicators of the currency pair:
Prev Open: 1.2993
Prev Close: 1.3005
% chg. over the last day: +0.09%
Yesterday, the USD/CAD currency pair was traded in a narrow range of 1.2986-1.3028 and closed with +0.09%. Today, the pair is being traded at yesterday’s close. On the H1 timeframe, USD/CAD is below the moving average MA 200. On the four-hour chart, the price is below the moving average. Based on the above, it is worth considering sales. It is also worth paying attention to the divergence on H1.
Trading recommendations
Support levels: 1.2985, 1.2928
Resistance levels: 1.3028, 1.3091, 1.3117, 1.3172
The main scenario: consider sales of an asset. If the price breaks through and fixes below the level of 1.2985, it is better to look for a sell entry point. The target will be the level of 1.2928.
Alternative scenario: if the price breaks through the level of 1.3028 and fixes above the 200 moving average on H1, we may consider a buy position to the level of 1.3091.