
Gold (XAU/USD) has made a massive bullish run in the year 2020. After reaching the -200% Fibonacci target, it has confirmed the development of a wave 3 rather than a wave C.
How far can the uptrend last and what targets? Let’s review.
Price Charts and Technical Analysis
XAU/USD has not been able to confirm a new high in the past 4 months. Here are the key aspects from a timing perspective:
The uptrend and wave 3 continuation (pink) still has the best odds in the first quarter of 2021.
But a failure to break by March 2021 could indicate a larger retracement in wave 4 (pink).
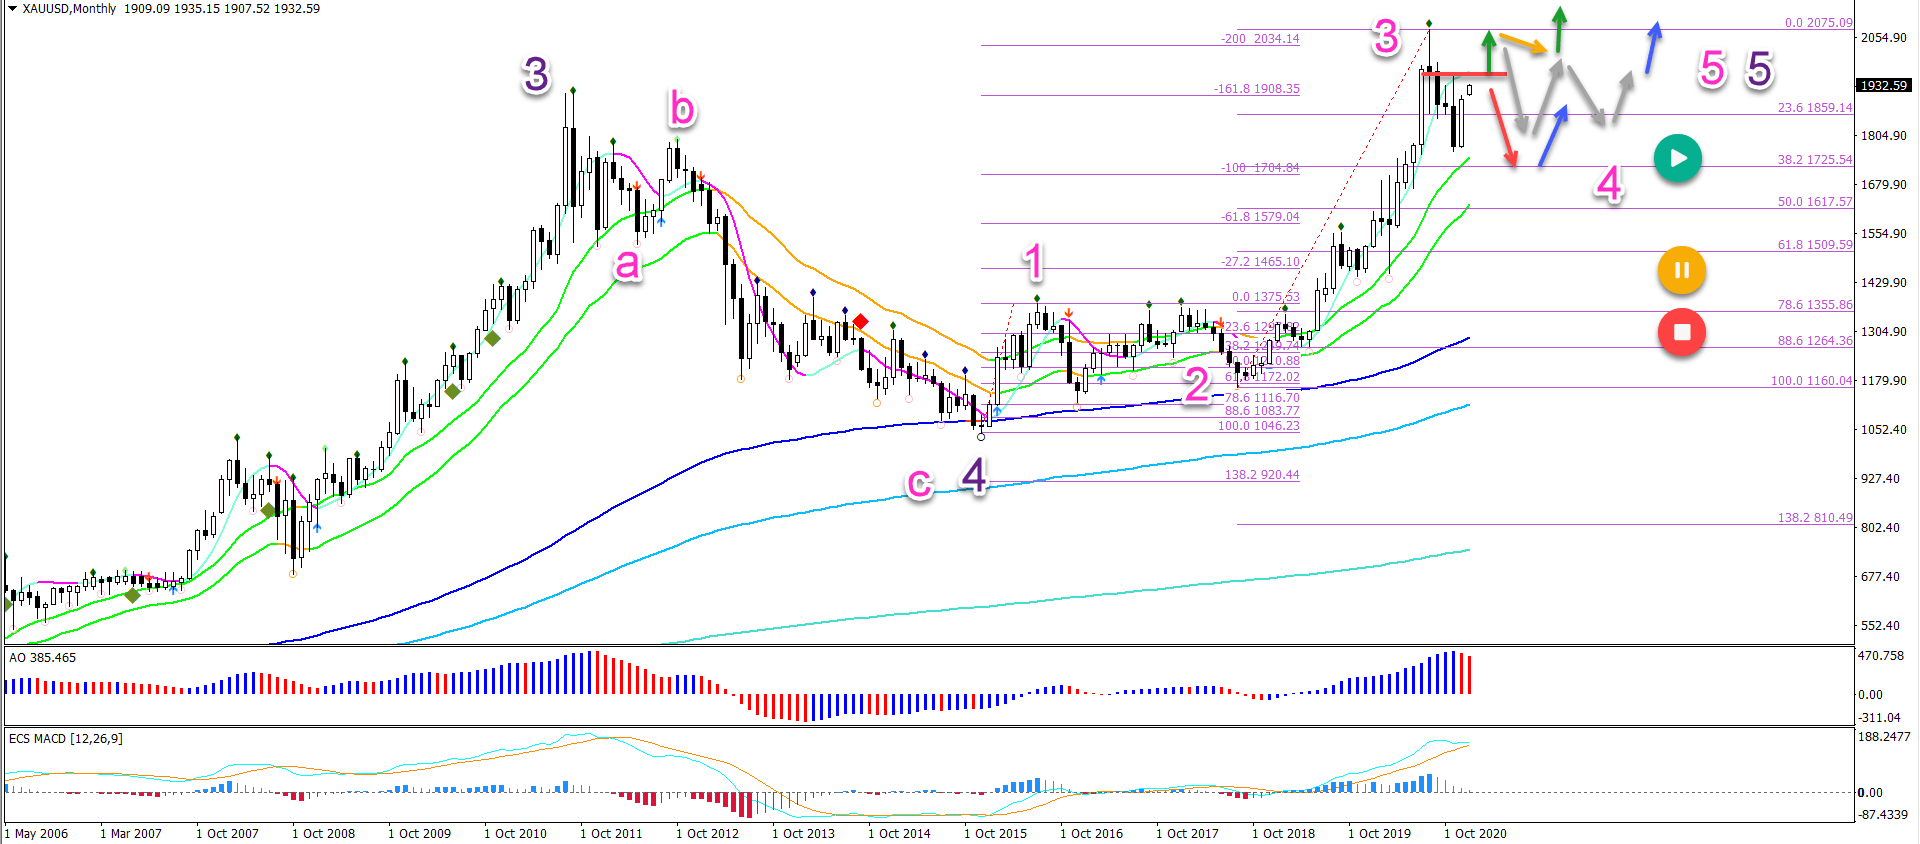
A bullish breakout (green arrow) above the resistance trend line (red) could confirm the continuation of the uptrend. But a bounce at the top could start a larger triangle pattern (grey arrows). The main target zones are at $2,250 and $2,500.
A failure to break could indicate a deeper retracement towards the 38.2% Fibonacci retracement level. The uptrend remains favourite as long as price action stays above the 61.8% Fibonacci retracement level.


