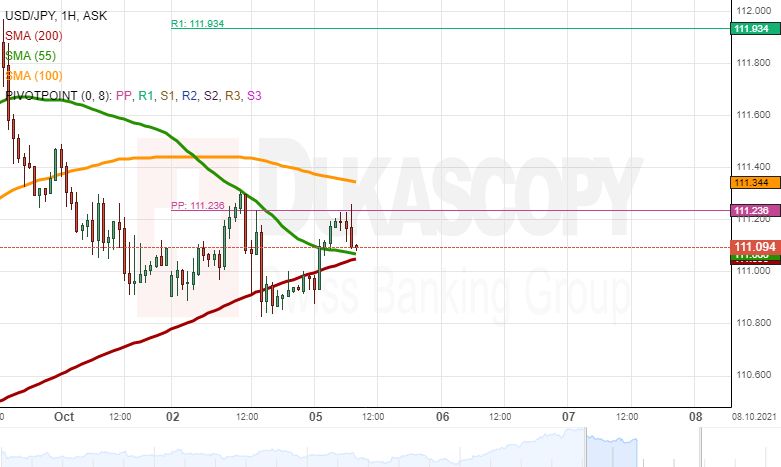
On Tuesday morning, the USD/JPY was located between the support of the 55 and 200-hour simple moving averages near 111.05 and the resistance of the weekly simple pivot point at 111.24 and the 100-hour SMA at 111.35.
If the pair surges and passes the weekly simple pivot point and the 100-hour simple moving average, the USD/JPY might aim at the resistance of the weekly R1 simple pivot point at 111.93. Above the pivot point, the 112.00 level could once again serve as resistance.
Meanwhile, a decline would look for support in the 55 and 200-hour simple moving averages at 111.05. In addition, the 111.00 level could provide support. However, note that the 200-hour SMA and the 111.00 failed to hold and were pierced during Monday’s trading. Due to that reason, it can be assumed that a potential decline could reach the weekly S1 simple pivot point at 110.39.