
Bitcoin continues its bullish momentum from last week, and after touching a low of $26,981 on April 24, we can see a move towards a consolidation phase, after which we are expecting upsides in the range of $28500 and $302000.
We can clearly see a bullish engulfing pattern above the $26,981 handle on the H1 timeframe.
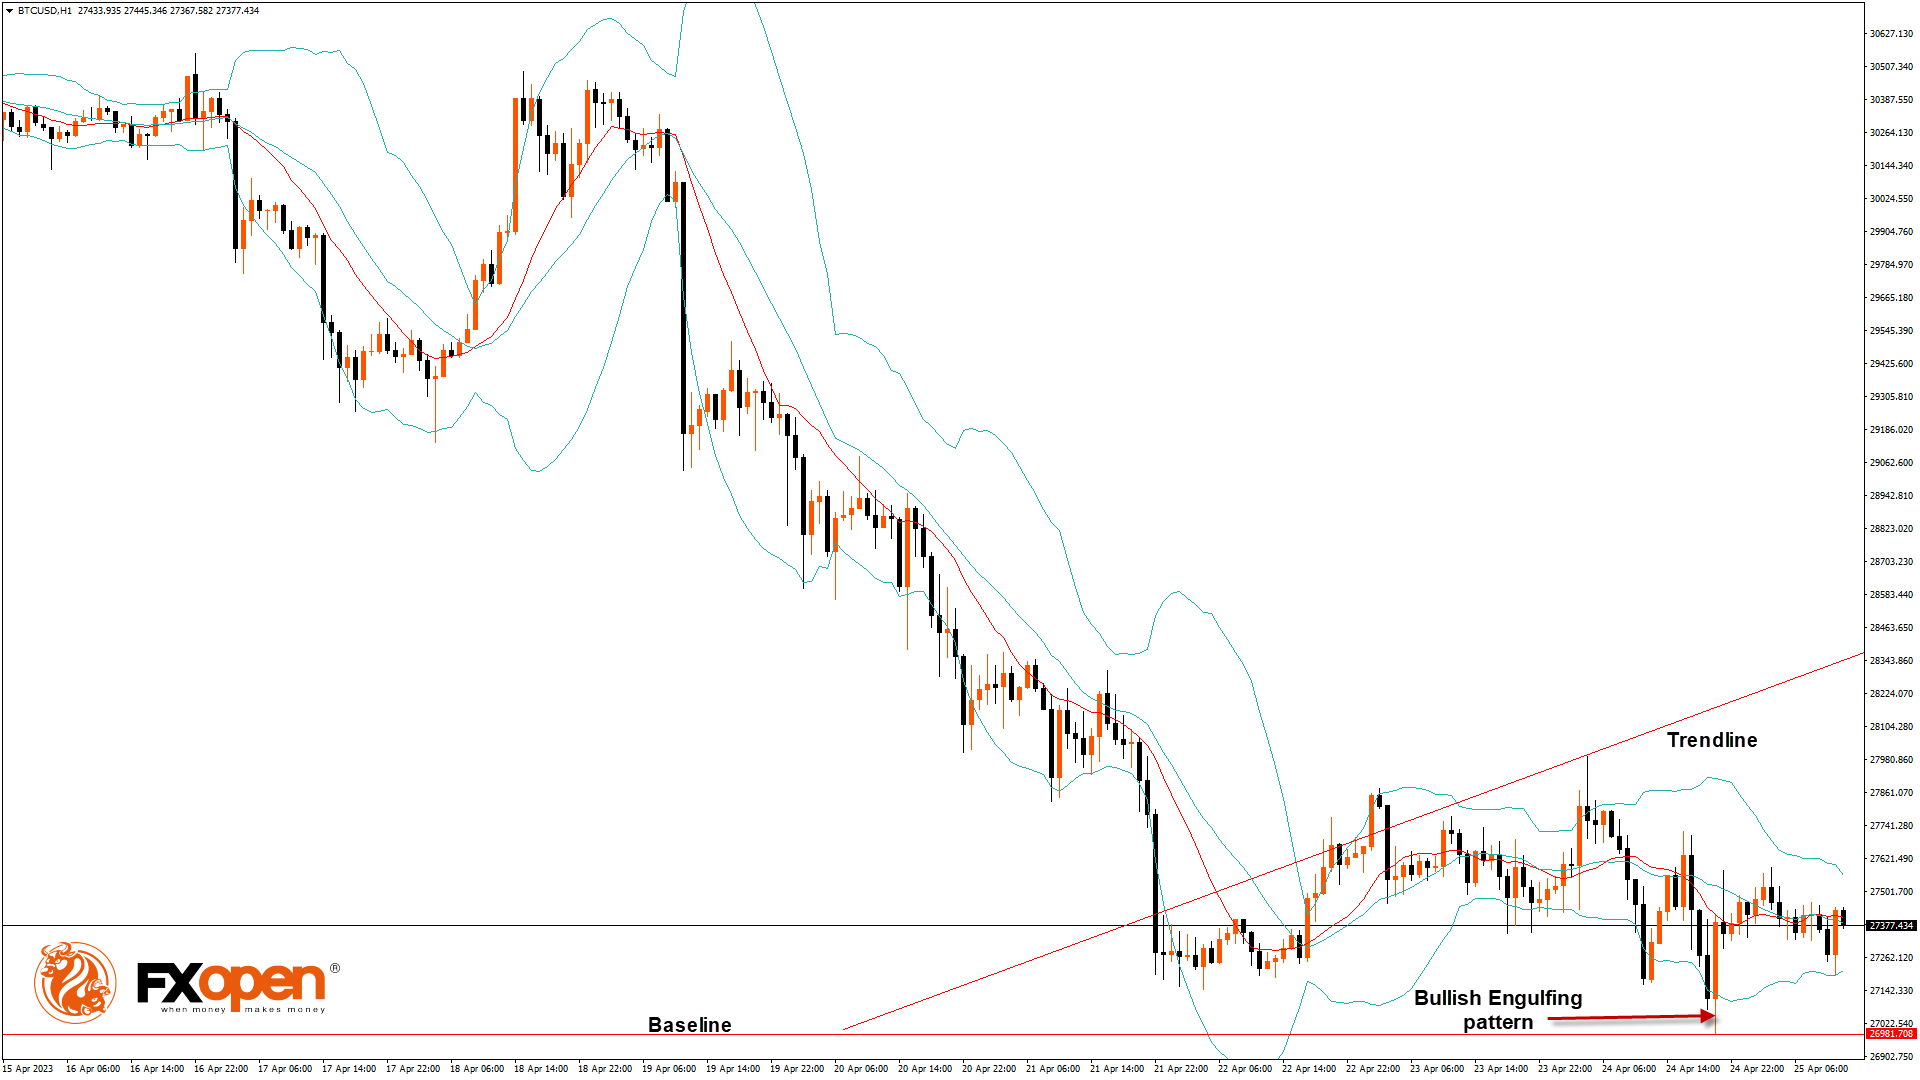
Bitcoin continues to move in a consolidation phase, after which we can see upside moves towards the $28,000 handle.
Both the STOCH and Williams’ percent range indicate overbought levels, which means that in the immediate short term, a decline in the price is expected.
We can also see the formation of bullish Harami pattern in the 1, 2 and 4 hourly timeframes.
The relative strength index is at 58.23, indicating a strong demand for Bitcoin and the continuation of the buying pressure in the markets.
Bitcoin is now moving above its 200-hour exponential moving average and above its 200-hour exponential moving average.
Most of the major technical indicators are giving a bullish signal, which means that in the immediate short term, we are expecting targets of $28,500 and $30,000.
The average true range indicates high market volatility with mild bullish momentum.
- Bitcoin bullish continuation is seen above $26,981.
- The RSI remains above 50, indicating a bullish market.
- The price is now trading below its pivot level of $28,516.
- The short-term range is mildly bullish.
- Some major technical indicators signal that the price may move to $28,000 and $29,500 soon.
Bitcoin Bullish Continuation Seen Above $26,981
The price of Bitcoin entered a consolidation zone below the $28,000 handle after which we can see the start of the bullish moves.
There is a bullish trend reversal pattern with adaptive moving average AMA-20 and AMA-50 in the 30-minutes timeframe.
The prices are ranging near the support of the triangle in the 1-hourly timeframe.
We have also seen a Bullish Doji located in the 15-minutes timeframe.
A support zone is located at $26,246, which is a 3-10 Day MACD Oscillator Stalls, and at $26,624, which is a 38.2% Retracement from 13 Week High.
BTCUSD is now facing its classic resistance level of $28,015 and Fibonacci resistance level of $28,508, breaking which the price will be able to move to $29,000.
There is an increase of 4.64% in the daily trading volume, which is normal. The short-term outlook for Bitcoin is bullish, the medium-term outlook has turned bullish, and the long-term outlook remains neutral under present market conditions.
The Week Ahead
Bitcoin continues its bullish momentum from last week, and after touching a low of $26,981 on April 24, we can see a move towards a consolidation phase, after which we are expecting upsides in the range of $28500 and $302000.
We can see that Bitcoin remains well supported above the $27,000 handle and the continuation pattern is seen, with the current support at $25,143, which is a 38.2% Retracement from 52-week low.
The immediate expected target is $29,000, after which we may see some consolidation in the zone of the $29,500 level.
Monthly RSI is at 49.68, which indicates the Neutral market and the shift towards the consolidation zone in the medium-term range.
We can see the formation of a bullish trend line from $26,981 to $28,355.
BTCUSD is now facing resistance at $27,943, which is a pivot point 1st resistance point, and at 28,152, at which the price crosses 18 day moving average stalls.


