
- Major downtrend phase from the 7 March 2022 swing high has evolved into a potential bullish reversal “Descending Wedge” configuration.
- US$77.30 is the key intermediate resistance (200-day moving average & upper boundary of “Descending Wedge”).
- Key short-term support rests at US$72.20, also the 50-day moving average.
Since its 7 Nov 2020 medium-term swing high of US$94.11 per barrel, the price actions of West Texas Oil (a proxy of WTI crude oil futures) have been oscillating within an 8-month bullish “Descending Wedge” configuration which suggests a potential major bullish reversal configuration in the process since its major downtrend phase from 7 March 2022 high of US$131.30 to 4 May 2023 low of US$63.67 that recorded a loss of -51.5%.
Major downtrend phase has evolved into a potential bullish reversal “Descending Wedge”
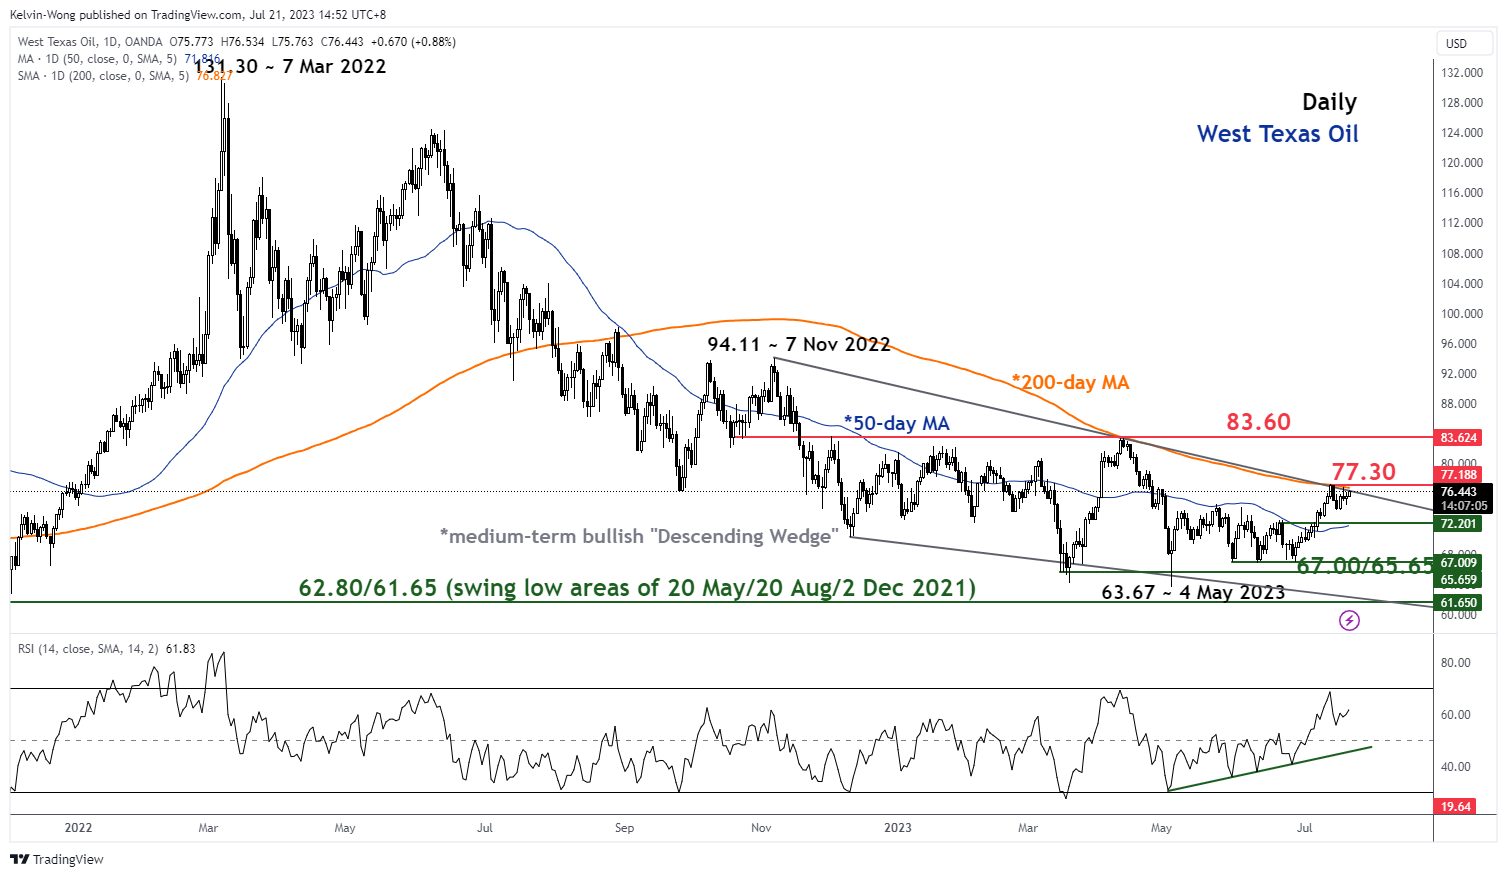
Fig 1: West Texas Oil major & medium-term trends as of 21 Jul 2023 (Source: TradingView, click to enlarge chart)
Oscillating within a short-term uptrend phase since 28 June 2023 low of US$66.95
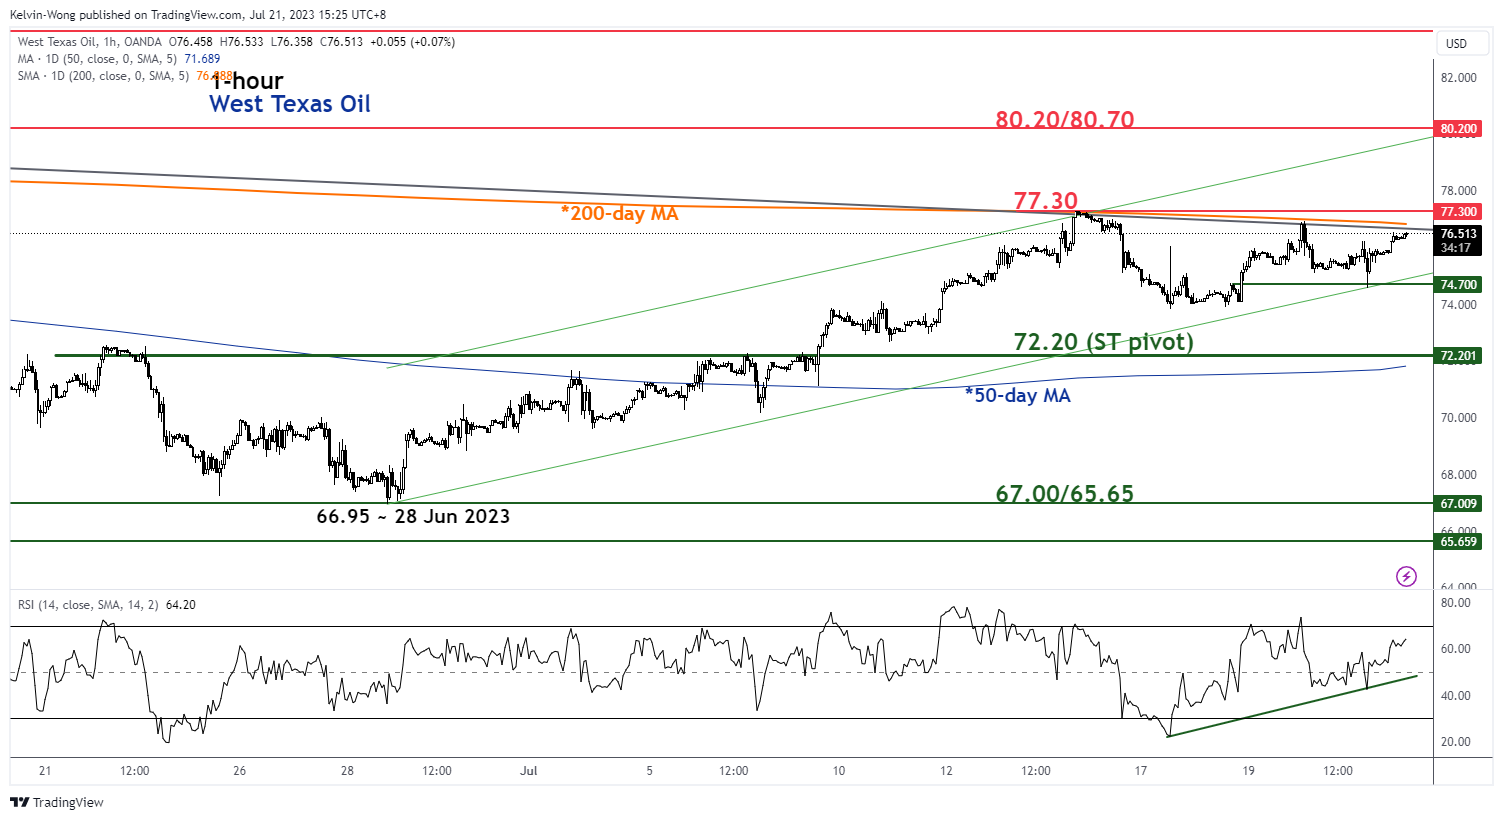
Fig 2: West Texas Oil minor short-term trend as of 21 Jul 2023 (Source: TradingView, click to enlarge chart)
Since its recent 28 June 2023 low of US$66.95, its price actions have started to evolve into a minor short-term uptrend phase and cleared above the 50-day moving average that is now turning upwards.
In addition, both the daily and hourly RSI oscillators are exhibiting positive configurations and readings which indicates that medium-term and short-term upside momentum remains intact.
A clearance above US$77.30 key intermediate resistance (the 200-day moving average & the upper boundary of the medium-term “Descending Wedge”) may see a bullish breakout towards the next resistance at US$80.20/80.70 (the upper boundary of the minor ascending channel from 28 June 2023 low & a Fibonacci extension cluster) (see 1-hour chart).
However, failure to hold above US$72.20 key short-term pivotal support (also the 50-day moving average) negates the bullish tone to expose the key medium-term support at US$67.00/65.65.


 have been oscillating within an 8-month bullish “Descending Wedge” configuration which suggests a potential major bullish reversal configuration in the process since its major downtrend phase from 7 March 2022 high of US$131.30 to 4 May 2023 low of US$63.67 that recorded a loss of -51.5%.)