
US personal income edged up by 0.2% mom, or USD 45.0 billion, missing the anticipated 0.3% increase. The modest gain in income primarily reflected an uptick in compensation, which was partially offset by a decline in personal current transfer receipts.
Conversely, personal spending outperformed expectations, registering a 0.8% mom rise, or an increase of USD 144.6 billion, compared to the projected 0.7%. This growth was predominantly driven by a USD 102.7 billion expansion in spending on services and a USD 41.9 billion increase in goods expenditure.
PCE price index and Core PCE price index (excluding food and energy), both rose 0.2% mom, matching market expectations. The components within the inflation basket displayed a mixed pattern, with prices for goods falling by -0.3% and prices for services rising by 0.4%. Additionally, food prices saw a modest increment of 0.2%, while energy prices edged up by 0.1%.
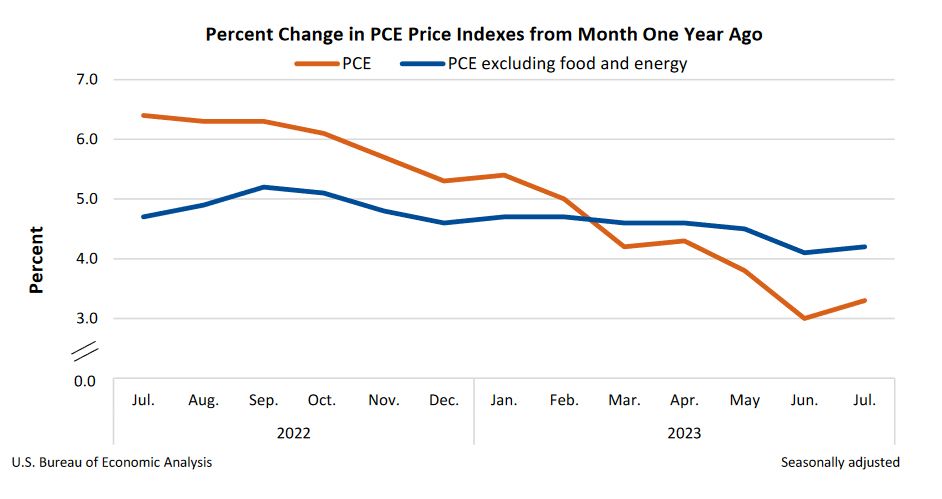
On a year-over-year basis, PCE price index climbed from 3.0% yoy to 3.3% yoy, while Core PCE price index ascended from 4.1% to 4.2%, both in alignment with market predictions. A disaggregated look at the year-over-year data reveals that prices for goods dropped by -0.5%, and prices for services surged by 5.2%. Meanwhile, food prices increased by 3.5%,and energy prices dipped by a notable -14.6%.


, both rose 0.2% mom, matching market expectations. The components within the inflation basket displayed a mixed pattern, with prices for goods falling by -0.3% and prices for services rising by 0.4%. Additionally, food prices saw a modest increment of 0.2%, while energy prices edged up by 0.1%.)