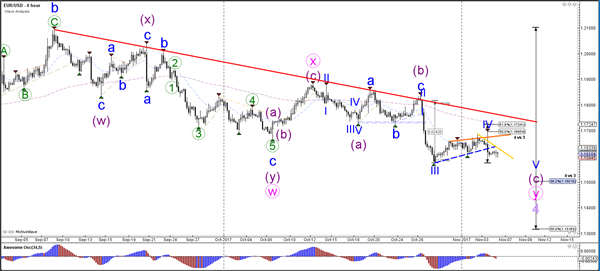
Currency pair EUR/USD
EUR/USD built a corrective pattern which is typical for a wave 4 (blue). The bearish breakout could indicate a potential continuation within wave 5 (blue) towards the Fibonacci retracement levels of wave 4 (light purple).
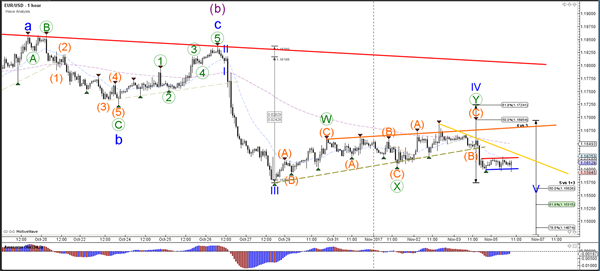
The EUR/USD is building a sideways zone within the bearish breakout. A bearish break below support (blue) could confirm more downside whereas a bullish break above resistance (red) could indicate a slightly larger correction. The bearish structure is invalidated if strong bullish price action is visible.
Currency pair GBP/USD
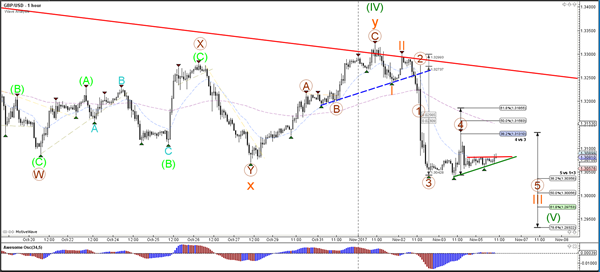
The GBP/USD broke the support trend lines (dotted blue) and is now building a triangle chart pattern. A new bearish breakout could indicate a potential continuation towards the Fibonacci targets of wave 5 vs 1+3 (green).
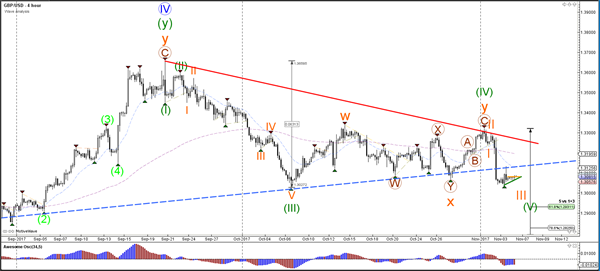
The GBP/USD retraced back to the 38.2% Fibonacci level of wave 4 (brown) of a larger wave 3 (orange).
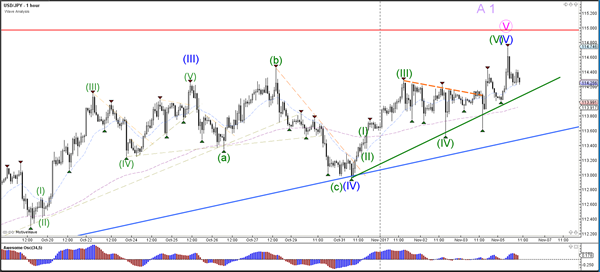
Currency pair USD/JPY
The USD/JPY is challenging the 114.50-115 resistance zone, which is a major break or bounce spot. The trend is up at the moment but price seems to be losing steam and speed as it approaches resistance (red).
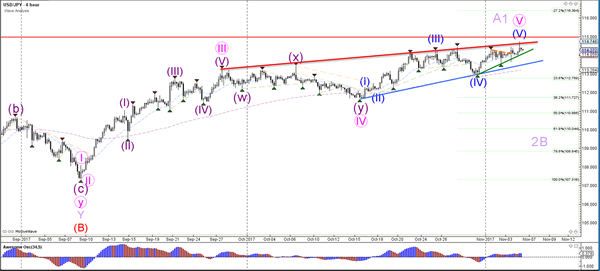
The USD/JPY will need to break above resistance or below support (blue) before the direction could be clear.