
The New Zealand Dollar (NZD) is facing slight downward pressure against the US Dollar (USD) and could dip further, though it’s unlikely to fall clearly below 0.5715. If it does break that support, reaching 0.5790 is doubtful. In the short term, analysts expected the NZD to move between 0.5735 and 0.5770, which it did—hitting both levels before closing at 0.5733, down 0.17%. The downward momentum has slightly increased, suggesting the NZD might edge lower today. However, any drop is expected to stay above 0.5715. This mild pressure will likely hold if the NZD remains below 0.5760, with minor resistance at 0.5745.
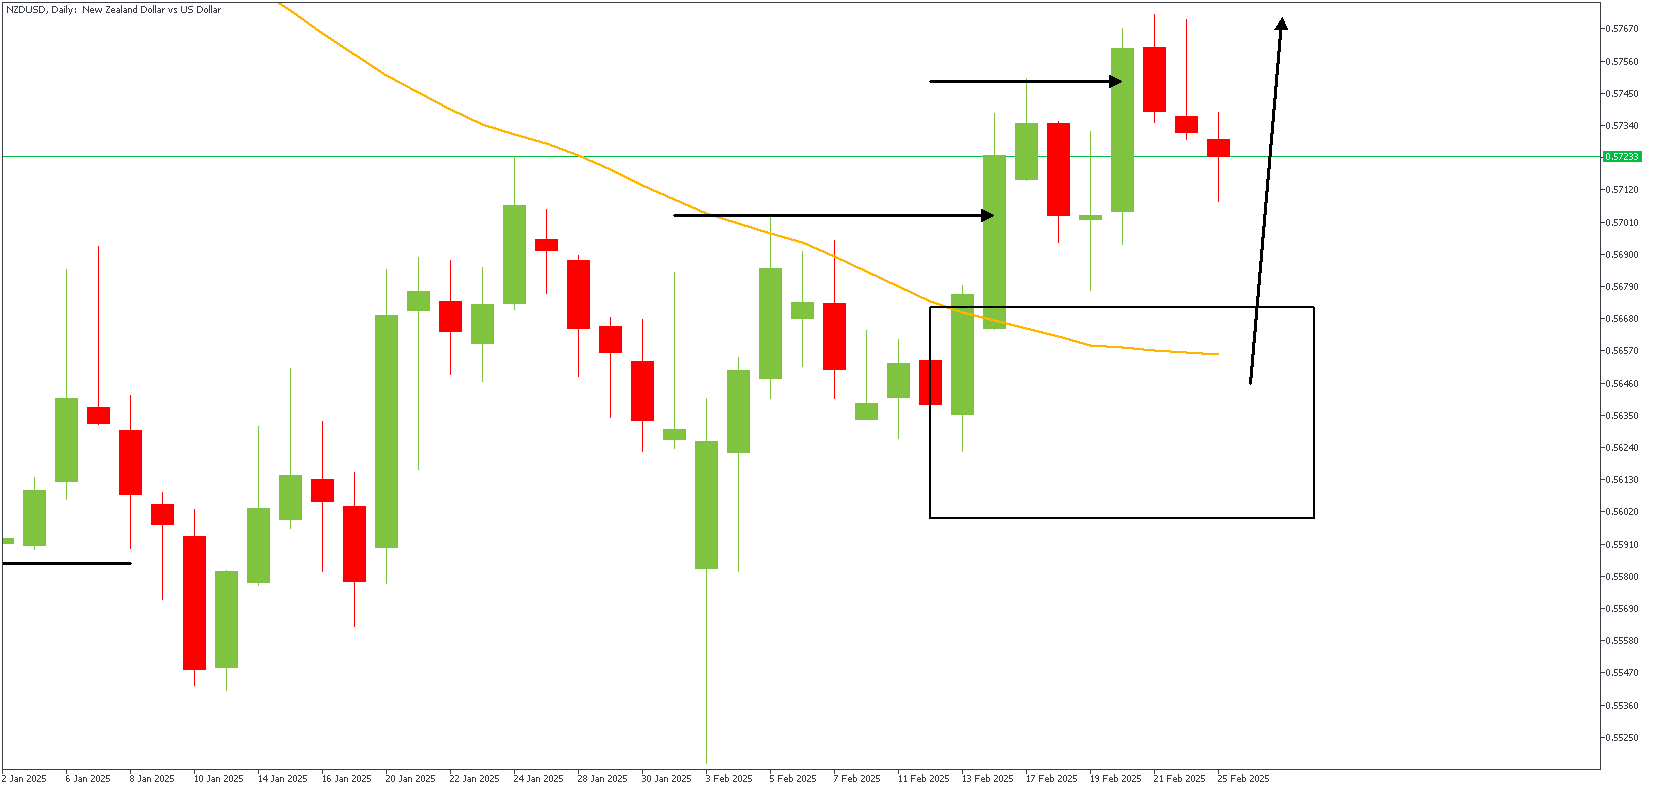
NZDUSD – D1 Timeframe
After breaking above the 50-day moving average, the price action on the daily timeframe chart of NZDUSD proceeded to overshoot the previous high, creating a new higher high in the process. The momentum from the breakout has waned, giving rise to the ongoing retracement move. The expectation is that the confluence region of the drop-base-rally demand zone and the 50-day moving average would provide adequate support for a bullish continuation.
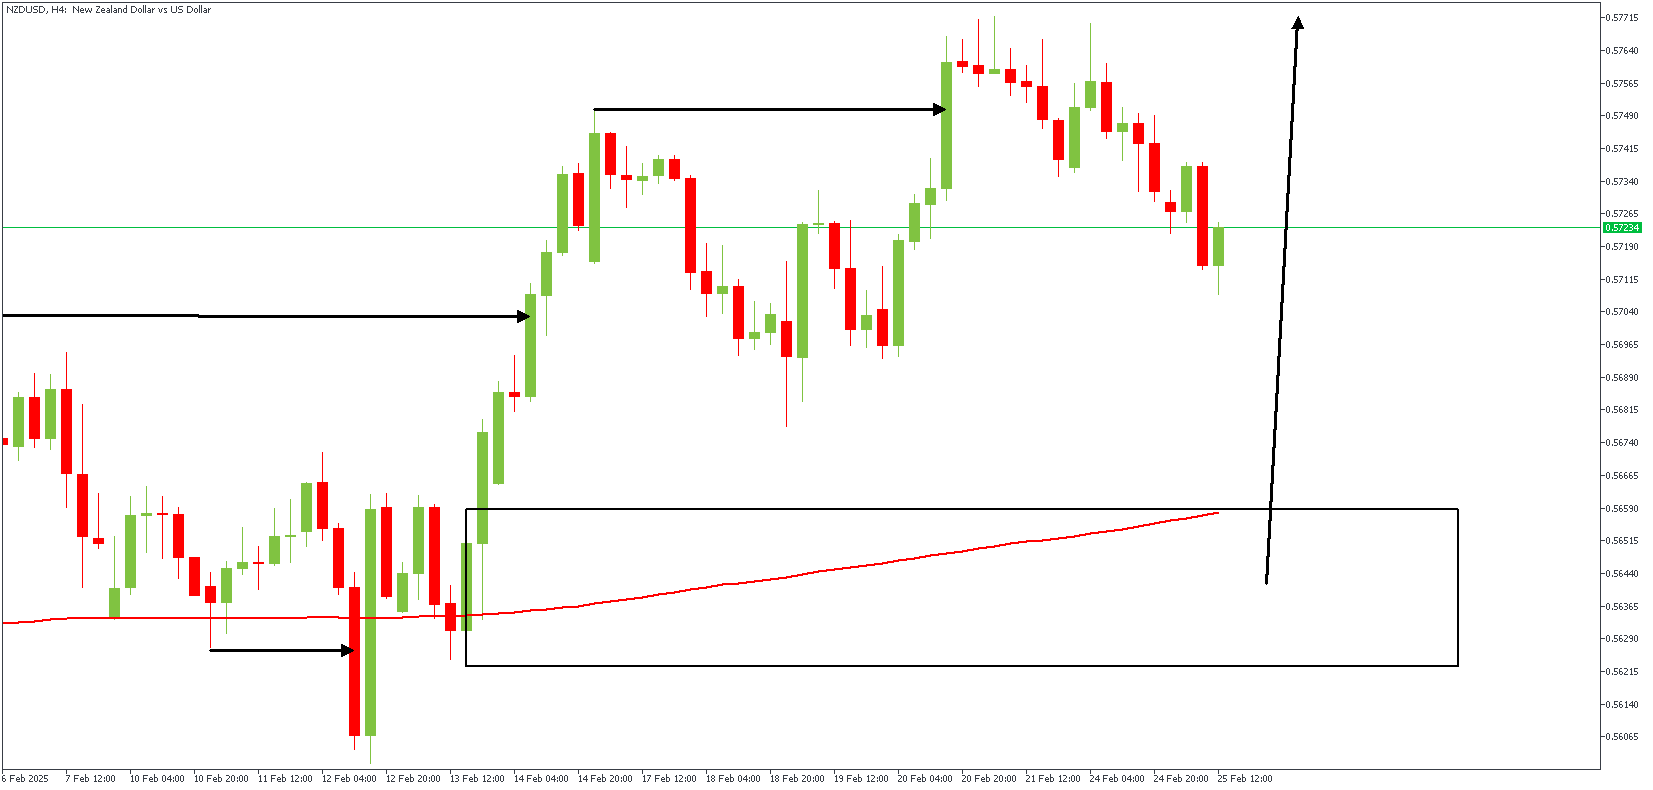
NZDUSD – H4 Timeframe
The 4-hour timeframe chart of NZDUSD shows that the daily timeframe demand zone doubles as the trough of a bullish SBR pattern, with the presence of an FVG, 100-period moving average support, 76% Fibonacci retracement level support, and liquidity at the previously induced low. The expected outcome in this scenario is bullish, with an initial target at the BSL (Buy-Side Liquidity) at the recent high.
Analyst’s Expectations:
- Direction: Bullish
- Target- 0.57713
- Invalidation- 0.56004


