
US Indices, which have started the day mixed, have appreciated this morning’s JOLTS report.
The data came out better than expected, with 7,391M Job Openings vs 7,200 Expected, a rise of 191,000 on the month.
This data set is still proving the strength of US Data amid geopolitical uncertainties.
Sentiment is positive throughout markets as gold did not maintain yesterday’s momentum, and indices are green all around.
Let’s look at the S&P 500 intra-day charts, as prices are less than 30 points from the 6,000 level.
S&P 500 Technical Analysis
S&P 500 4H Charts
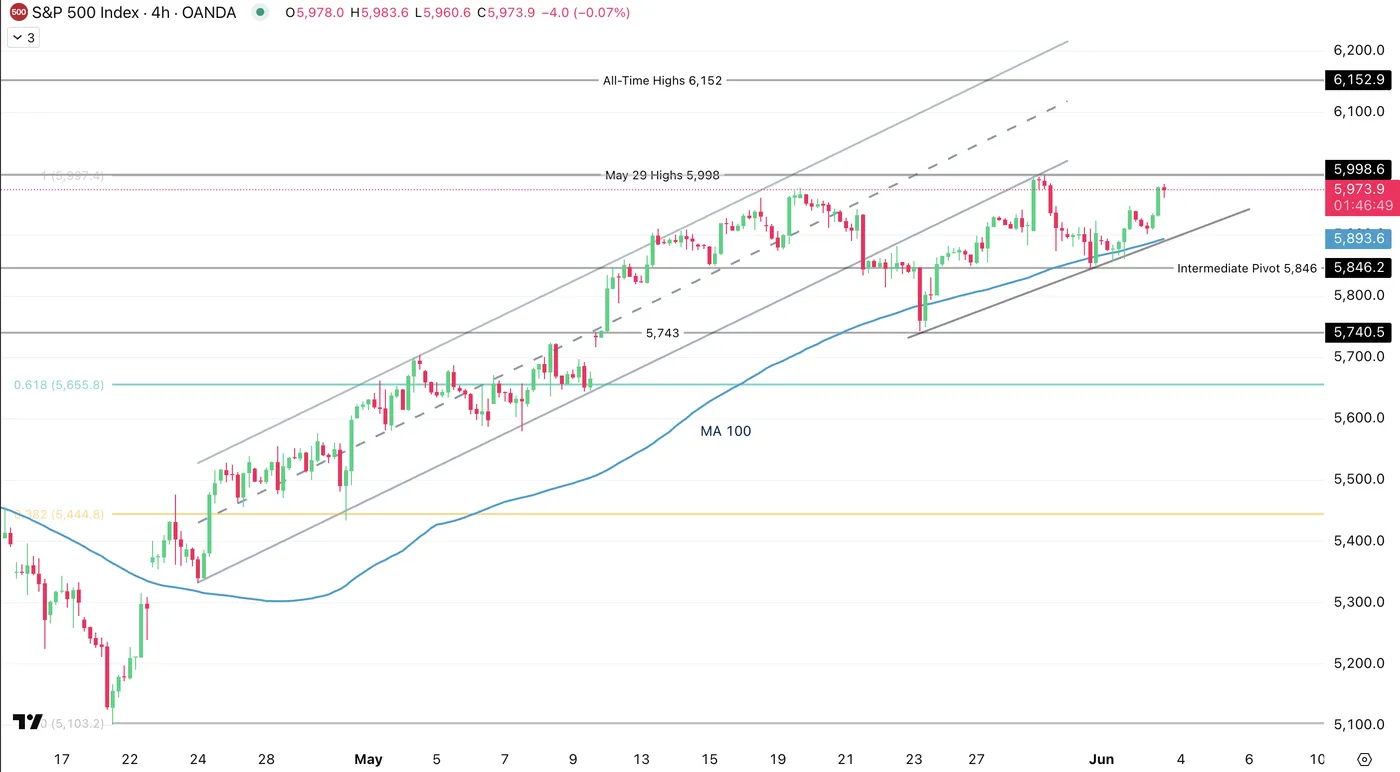
S&P 4H Chart, June 3, 2025. Source: TradingView
The S&P caught some decent momentum into the beginning of the week as US data has been coming better than expected.
A month-end bounce on the Immediate Pivot at 5,846 has led to a 125 point rally, forming an upward trendline consolidated by the 4H 100 period moving average.
Any breakout higher will look to test the all-time highs of 6,152- though more positive news and economic data will be required.
Let’s take a closer look.
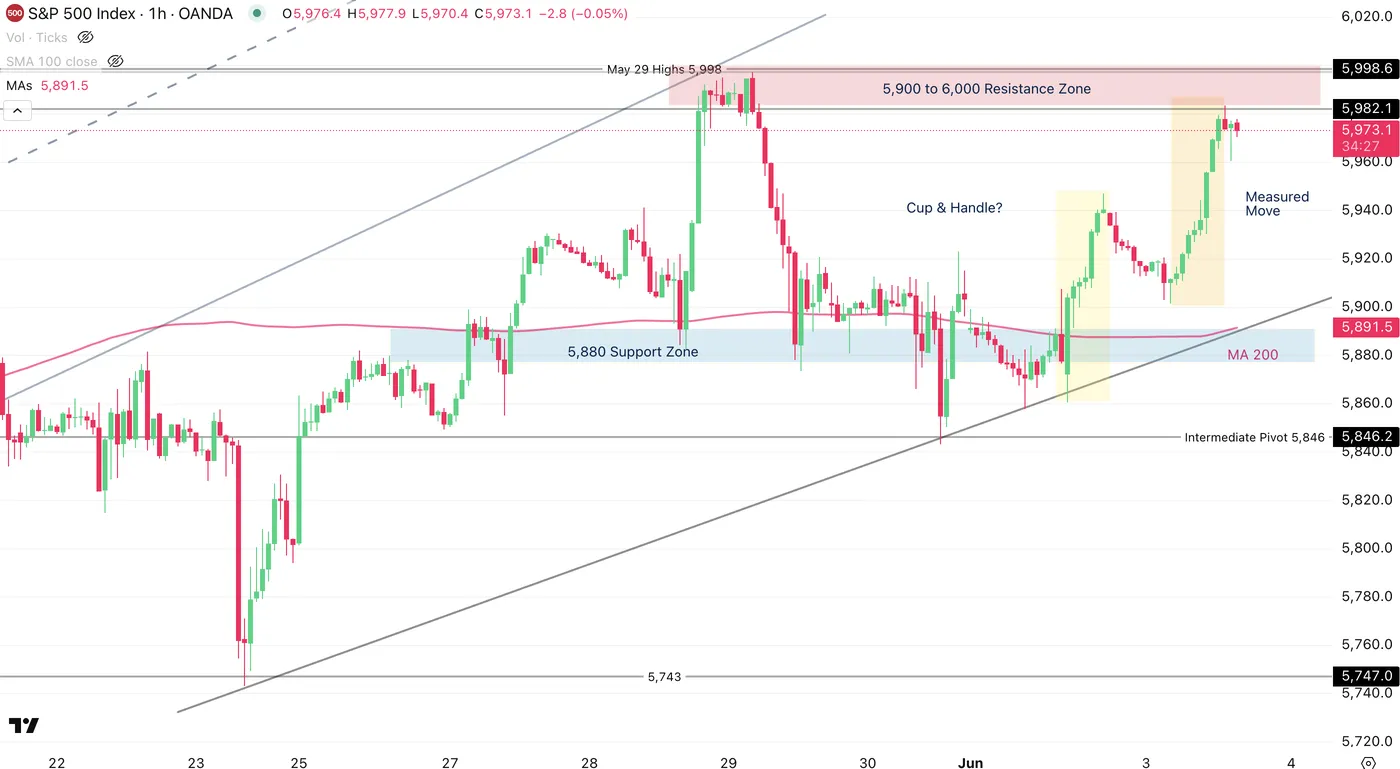
S&P 1H Chart, June 3, 2025. Source: TradingView
The S&P approached current levels with bullish impulsive measured moves, forming what resembles a Cup & Handle pattern – typically seen as bullish.
The overall bullish structure, held by the MA 200 at 5,891 within the current support zone, will meet some hurdles.
We are approaching the 5,990 to 6,000 resistance zone which may generate position closing as this month’s Non-Farm Payroll report is looming.
A positive report may break through this level in a swing towards a test of the ATH, although a bad surprise might just do the reverse to revisit the 5,730 May Lows.
Safe Trades!


