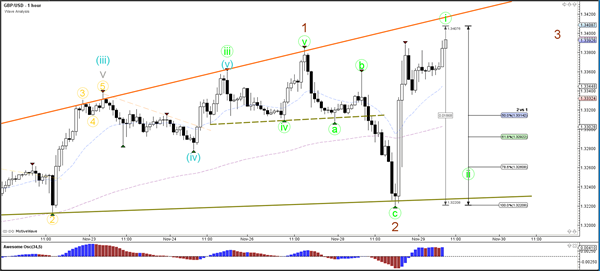
Currency pair GBP/USD
The GBP/USD made a bearish bounce at the resistance (red) zone but then found strong support about half way the range. The bullish bounce is showing strong momentum and price could now be ready for a larger bullish breakout. For the moment the bearish wave 4 of yesterday seems unlikely after this bullish break and price could be ready for a wave 5 (orange).
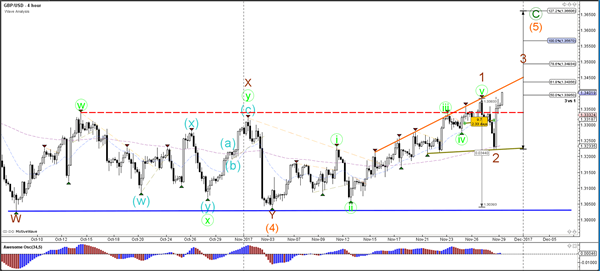
The GBP/USD could be building a wave 1 (green) within wave 3 (brown).
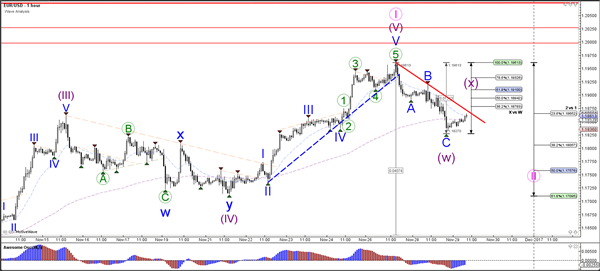
Currency pair EUR/USD
The EUR/USD seems to have completed a wave 1 (pink) and price could now be building a wave 2 retracement (pink).
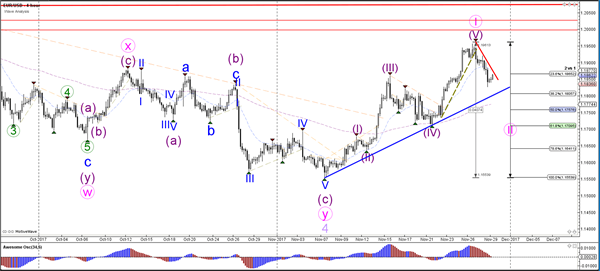
The EUR/USD completed an ABC (blue) zigzag yesterday but price could extend the correction via WXY (purple) within that wave 2.
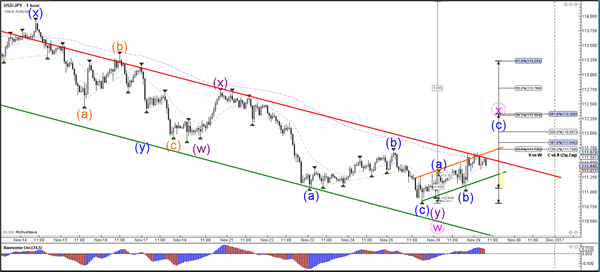
Currency pair USD/JPY
The USD/JPY bounced at the 50% Fibonacci support level and is now at the resistance top of the bearish channel (red).
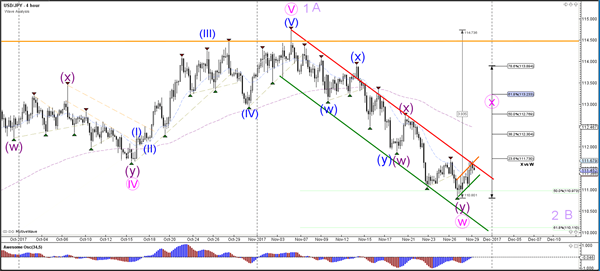
The USD/JPY could be building a bear flag chart pattern within a larger wave C (blue). A bearish breakout could see price fall towards the Fibonacci targets whereas a bullish break could see price test the Fibonacci levels.