
Earlier last week, the USD/JPY surged to a four-month high of 150.92 on 1 August, but its prior accumulated gains of the previous four sessions were all wiped out and formed a weekly bearish “Shooting Star” at the close of last Friday, 1 August US session.
These observations suggest a potential bullish breakout on the USD/JPY above the key 200-day moving average and the upper boundary of its medium-term ascending range configuration in place from the 22 April 2025 low as it reintegrated back below the 149.50 level.
Since the start of this week, 4 August, through today’s Asian session on 8 August, the Japanese yen has lagged behind other major currencies against the greenback. While the US Dollar Index has fallen 0.5%, the USD/JPY has posted a smaller decline of just 0.2%.
Let’s dissect the latest technical developments in the USD/JPY and construct a possible short-term trading set-up from a technical analysis perspective.
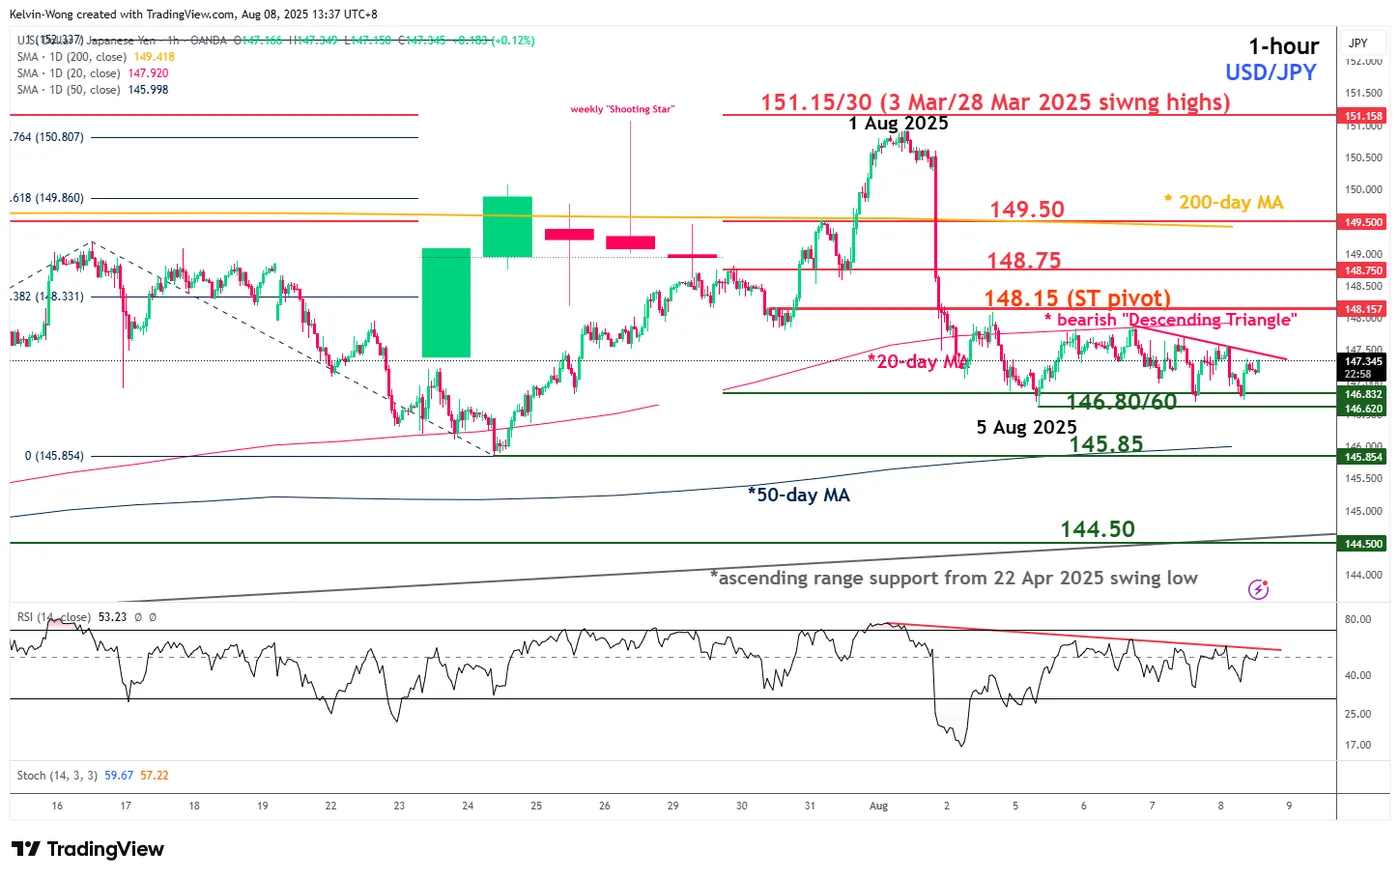
Fig. 1: USD/JPY minor trend as of 8 Aug 2025 (Source: TradingView)
Preferred trend bias (1-3 days)
A potential minor bearish breakdown looms on the USD/JPY within a medium-term ascending range configuration in place since the 22 April 2025 swing low of 139.89.
Bearish bias below 148.15 short-term pivotal resistance, and a break below 146.60 may expose the next supports at 145.85 (50-day moving average) in the first step before the medium-term support at 144.50 (lower boundary of the ascending range configuration from 22 April 2025 low).
Key elements
- From Friday, 1 August, to Tuesday, 5 August, USD/JPY experienced a 430-pip decline (high to low), with price action remaining below its 20-day moving average.
- The USD/JPY has formed a minor “Descending Triangle” bearish range continuation configuration with its downside trigger level at 146.60 below the 20-day moving average.
- The hourly RSI momentum indicator has been capped by a parallel descending resistance at the 56 level, which suggests the lack of upside momentum in USD/JPY.
Alternative trend bias (1 to 3 days)
A clearance above 148.15 invalidates the bearish scenario and sees a squeeze up towards the upper limit of the medium-term ascending range for the next intermediate resistances to come in at 148.75 and 149.50 (also the key 200-day moving average).


