
USDCAD rises from a disappointing Canadian Employment number.
The data which came at -40.8K vs 13.5K expected , takes out half of the past month’s upwards surprise (+83K) and looking at the detail, full-time employment saw the most regression (-51K) while part-time employment rose by a small margin.
Overall, the unemployment rate came as expected (6.9% vs 6.9% exp) but overall, Canada has been struggling with job creation for a while now.
Canadian Employment data tends to be pretty volatile, especially during summer.
In the meantime, the Loonie had appreciated a bit against the US Dollar in the past few days. With not many factors prompting participants to buy the CAD, it was more a selloff in the Greenback which took the pair to retest the highs of the past month range.
Let’s take a detailed look at USDCAD.
USDCAD Multi-timeframe analysis
USDCAD Daily Chart
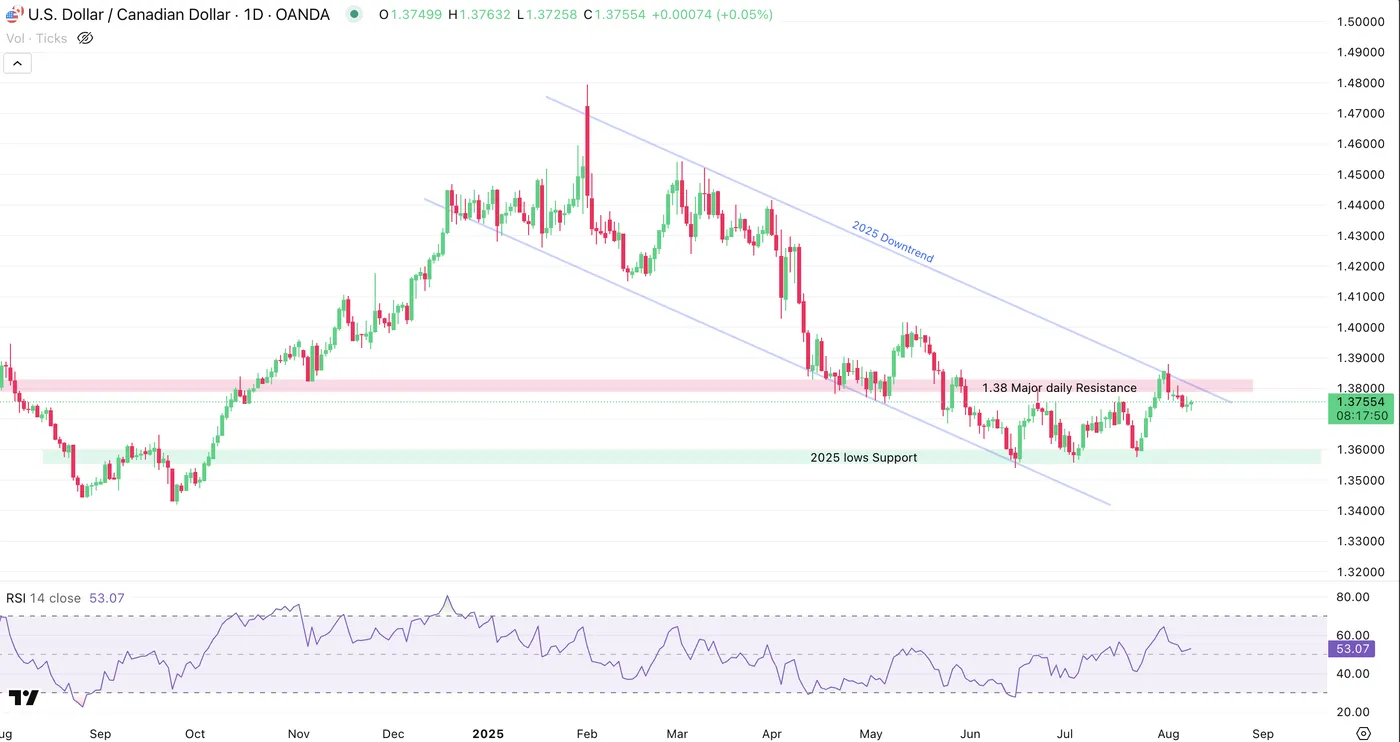
USDCAD Daily Chart, August 8, 2025, Source: TradingView
Despite the strong rally at the end of July, the pair holds within its 2025 downwards channel.
RSI Momentum saw a deceleration of bullish momentum after last Friday’s US Jobs data that also disappointed, but stays above the neutral line.
Holding the channel will be the element to look at on higher timeframes for the pair.
Let’s take a closer look to spot how the miss impacted the Loonie.
USDCAD 4H Chart
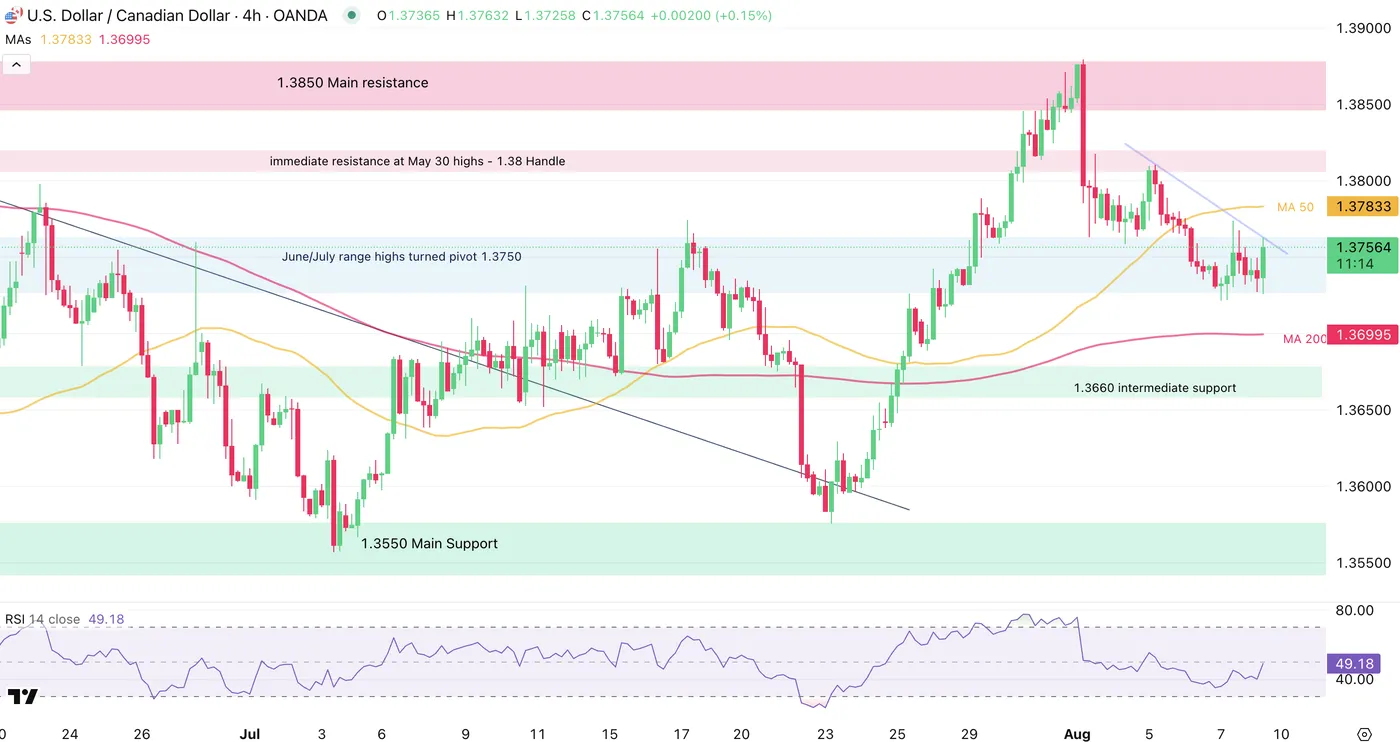
USDCAD 4H Chart, August 8, 2025, Source: TradingView
The pair rose about 200 pips after this morning’s data, but buyers are stepping against a downwards intermediate trendline (blue).
Bullish momentum is gathering and the rest is to see if the 1.37630 highs can be broken
A lack of more conviction from buyers could leave the pair ranging for the day – For future outlooks, keep an eye on the action being constrained within the 4H MA 200 (as support – 1.3699) and the 4H MA 50 as resistance (1.3783)
Breaking below the pivot zone would also mean a re-entry of the June/July range between 1.3550 to 1.3750.
Key levels for the pair
Support Levels:
- range highs turned pivot 1.3750
- Intermediate support Zone 1.3660
- 1.3550 (2025 Lows, Main Support)
Resistance Levels:
- 1.3850 Main Resistance
- 1.38 intermediate Resistance
- 1.3783 4H MA 50
USDCAD 1H Chart
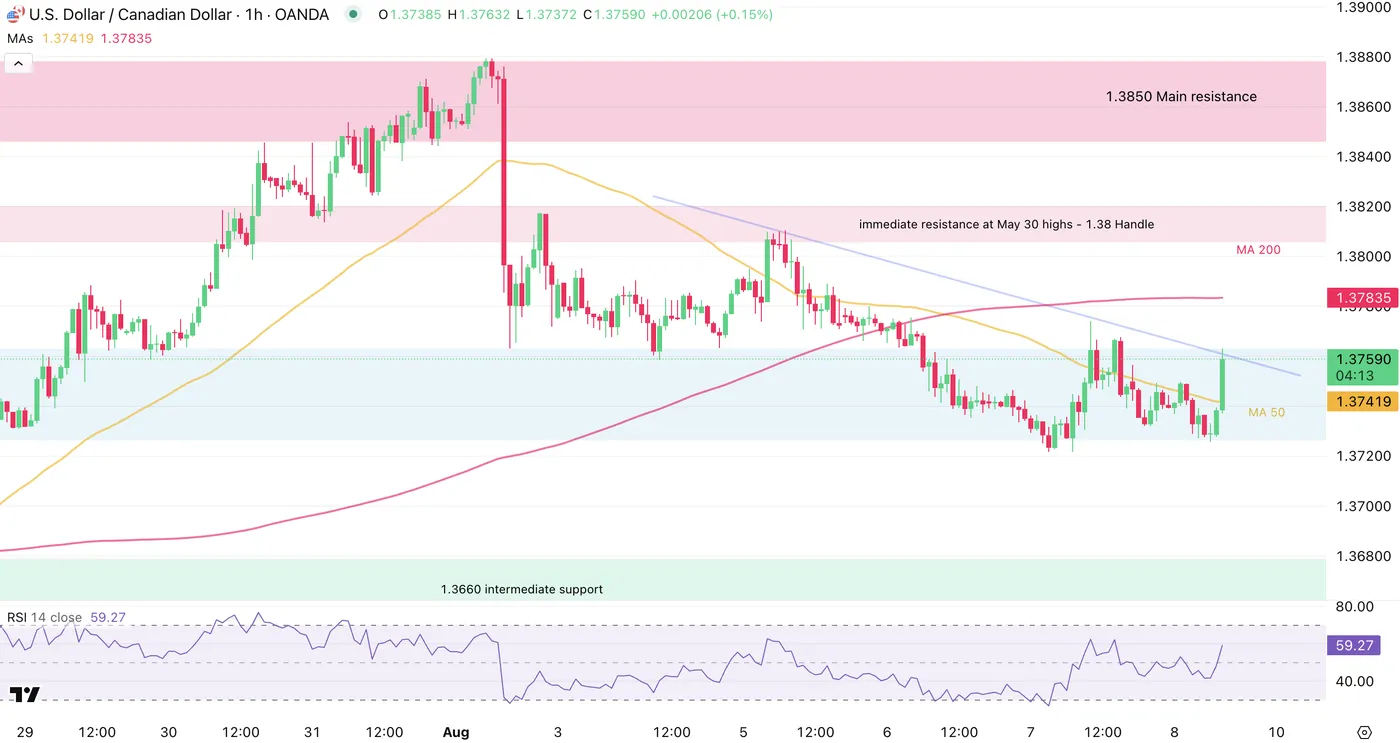
USDCAD 1H Chart, August 8, 2025, Source: TradingView
Buyers are stepping in strong – For the rest of the price action, the element to track is whether buyers break the imminent downwrads trendline that is just getting tested.
Daily highs: 1.3773
Daily lows: 1.3722
Safe Trades!


 and looking at the detail, full-time employment saw the most regression (-51K) while part-time employment rose by a small margin.)