
Silver has outshined its peers in terms of performance, bolstered by the increasingly-menaced FED independence and Gold also rallying to new all-time highs.
The fundamentals are not changing: Markets are still anxious about the future outlook for the US Dollar with the Trump Administration’s US Exceptionalism policy.
As time progressed, and despite some harsh tariffs that will start to bite into US Importers’ profits, it seems that Markets were putting less emphasis on such policies with the Dollar Index stopping its early-2025 fall-off.
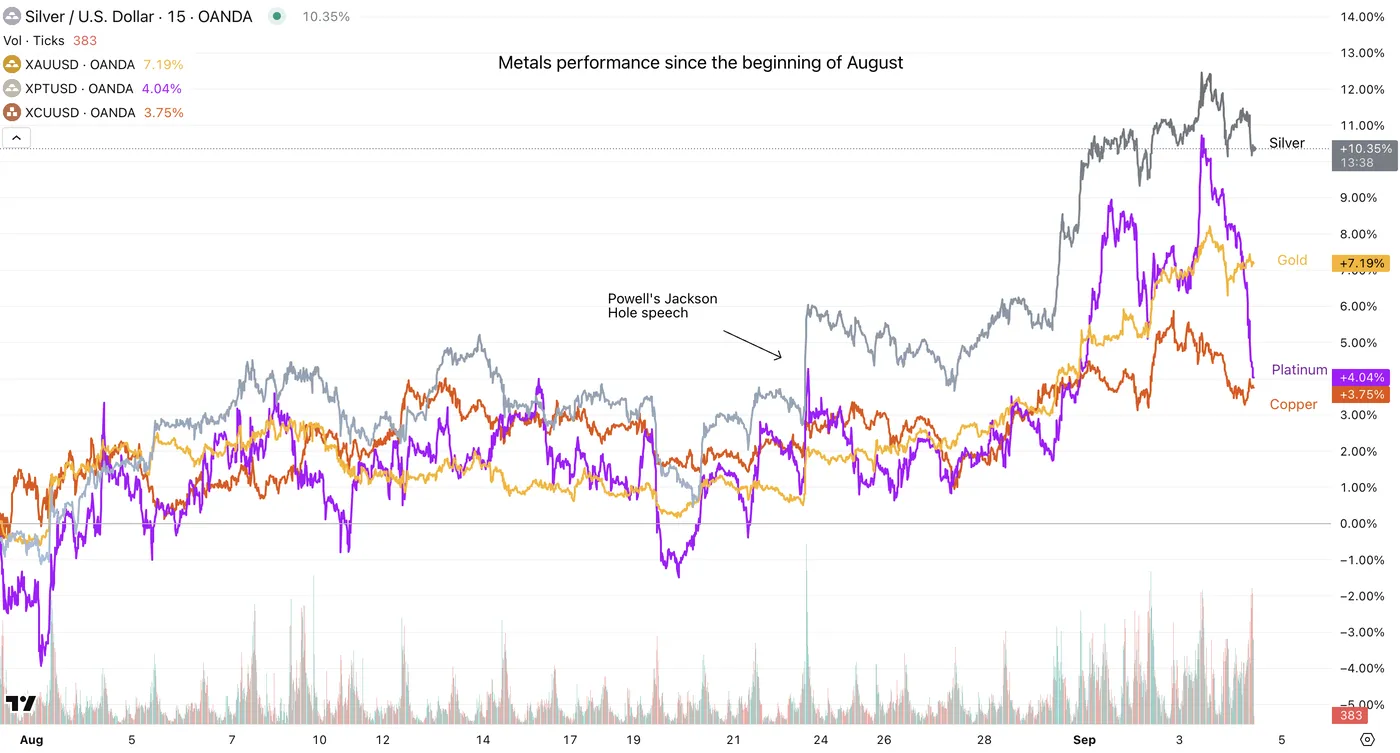
Metals comparative performance since August 2025 – Source: TradingView
The US Dollar’s status as reserve currency is still far from being replaced.
Nonetheless, firms and central banks have been looking for ways to diversify from risks to the Greenback and related assets like US Treasuries (still largely the most liquid non-cash asset).
Geopolitic events such as the most recent Chinese Military Parade (the largest ever), celebrating the 80 years since the end of WW2 and hosting Vladimir Putin and Kim-Jong Un are also such testaments of the tone changing a little – The next 10 years are going to be interesting.
Anyway, let’s log in to a few Silver charts, to see what are the bigger picture trends and get levels ahead of the Non-Farm Payrolls release.
Silver higher-timeframe technical analysis
Silver (XAG) Monthly chart
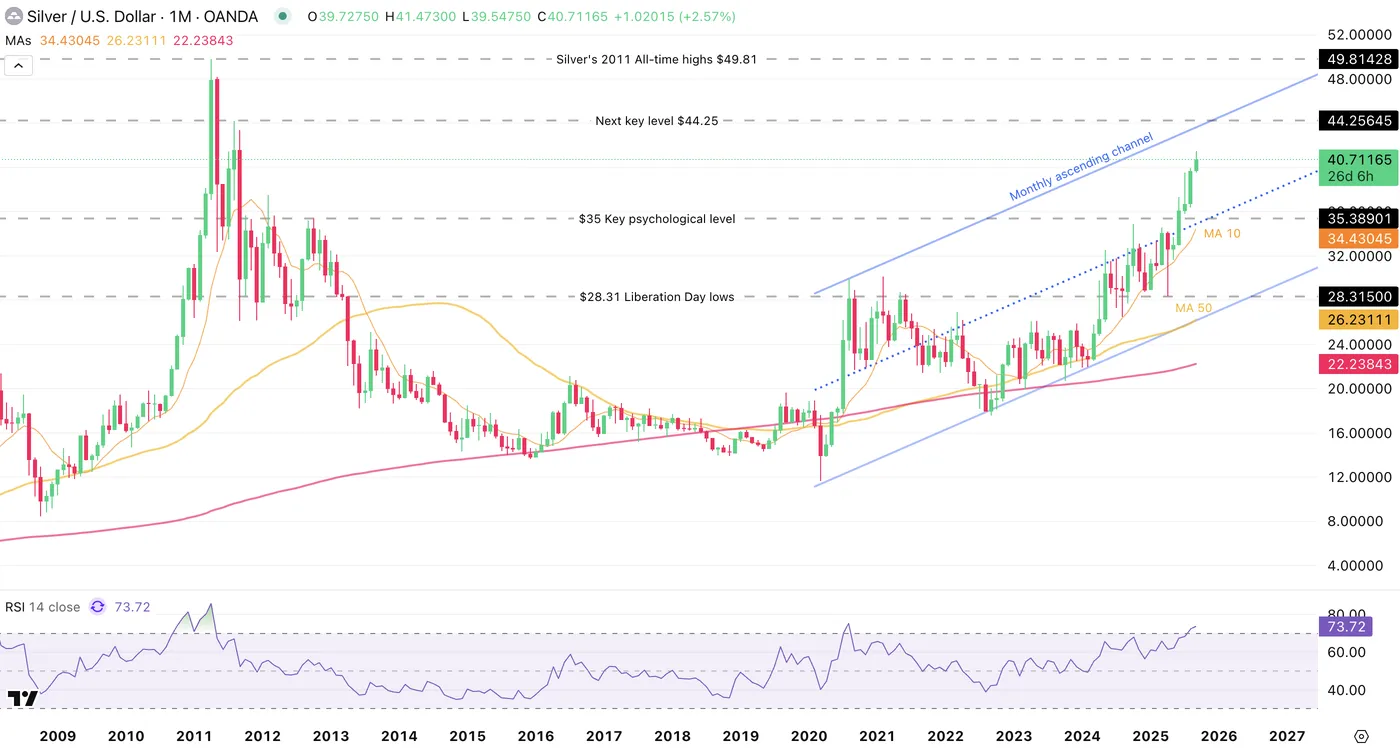
Silver Monthly Chart, September 4, 2025 – Source: TradingView
Silver is progressively spiking towards the August 2011 highs after breaking the $40 psychological barrier.
A Monthly ascending channel comes at a confluence with August 2011 highs ($44 to $44.50) and may act as a longer-timeframe profit-taking area.
On the other hand, depending on the global outlook and any further geopolitical/dollar-led tensions, a further breakout above the upper bound is possible towards a retest of the previous ATH (still far from now, but holds a decent probability).
The Daily picture during 2011 spikes
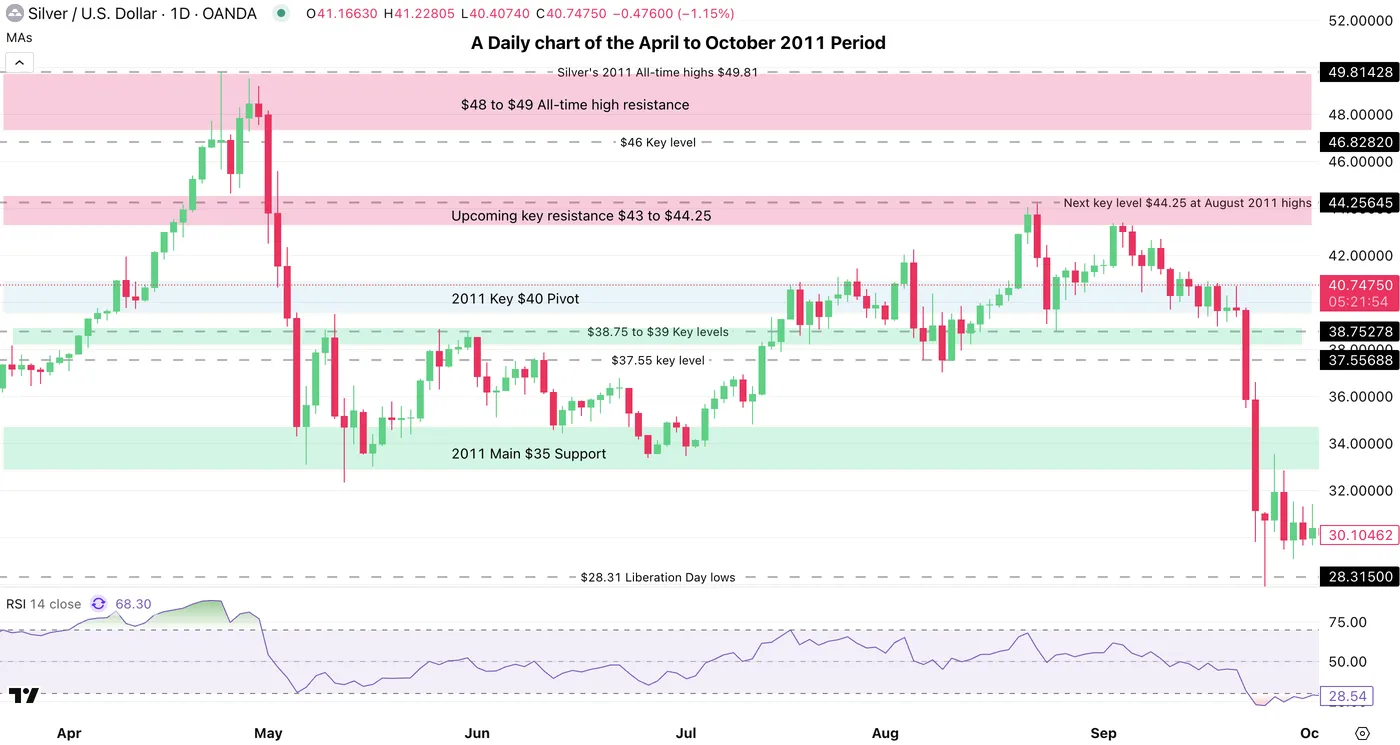
A Daily chart of the April to October 2011 Period – Source: TradingView
You can observe on this 2011 look-back how some key areas that will soon be tested either to the upside or downside and should influence upcoming flows for XAG trading.
One of the only scenario that would restrain the ongoing rally would be a very strong Non-Farm Payrolls which would lead to huge US Dollar rallies and a consequent profit-taking in metals.
For the rest, as expected should maintain the current-trend/consolidation period around the $40 pivot.
Any miss should boost Silver’s momentum (the extent of the miss will influence the extent of the rally)
The current Daily picture with the 2011 support/resistance levels
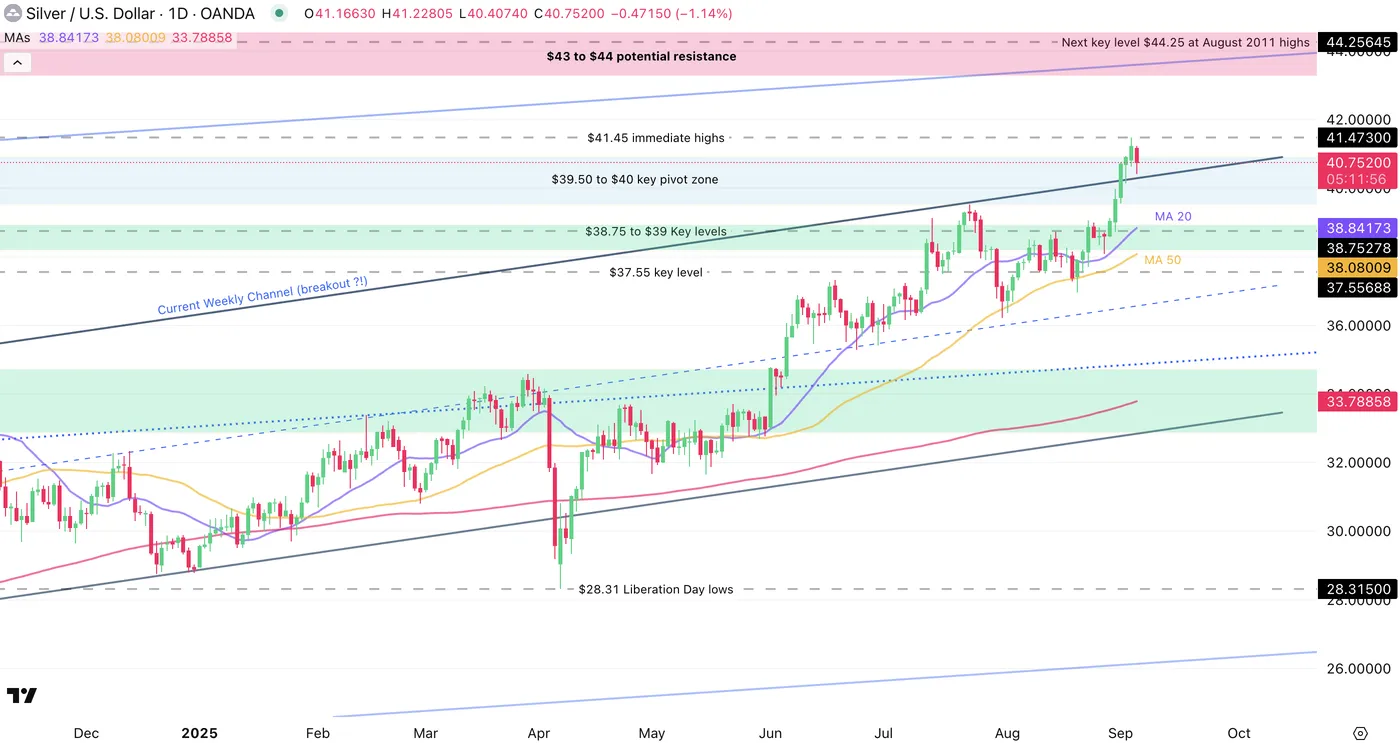
Silver Daily chart (current trading), September 4, 2025 – Source: TradingView
Silver has recently broken out of its weekly channel, indicating how strong the current trend is. The end-August to beginning September moves have been surprising.
Tomorrow’s release and the September FOMC will shape up future demand for metals and will have huge influence on upcoming flows.
Levels to watch for Silver (XAG) trading:
Resistance Levels:
- $41.45 recent highs
- $42 psychological level
- $43 to $44 potential resistance
- August 2011 $44.25 top
Support Levels:
- $39.50 to $40 key pivot zone
- Support 38 to $38.5
- 2012 Highs Support around 37.50
Safe Trades!


