
Key Highlights
- WTI Crude Oil prices started a fresh decline below the $64.20 support.
- The price traded below a key bullish trend line with support at $63.80 on the 4-hour chart.
- Gold rallied further to a new all-time high above $3,640.
- Bitcoin is attempting to recover but upside might be capped near $115,000.
WTI Crude Oil Price Technical Analysis
WTI Crude Oil price failed to stay above $65.50 against the US Dollar. There was a strong bearish reaction below $65.00 and $64.00.
Looking at the 4-hour chart of XTI/USD, the price traded below a key bullish trend line with support at $63.80. There was a close below the 100 simple moving average (red, 4-hour) and the 200 simple moving average (green, 4-hour).
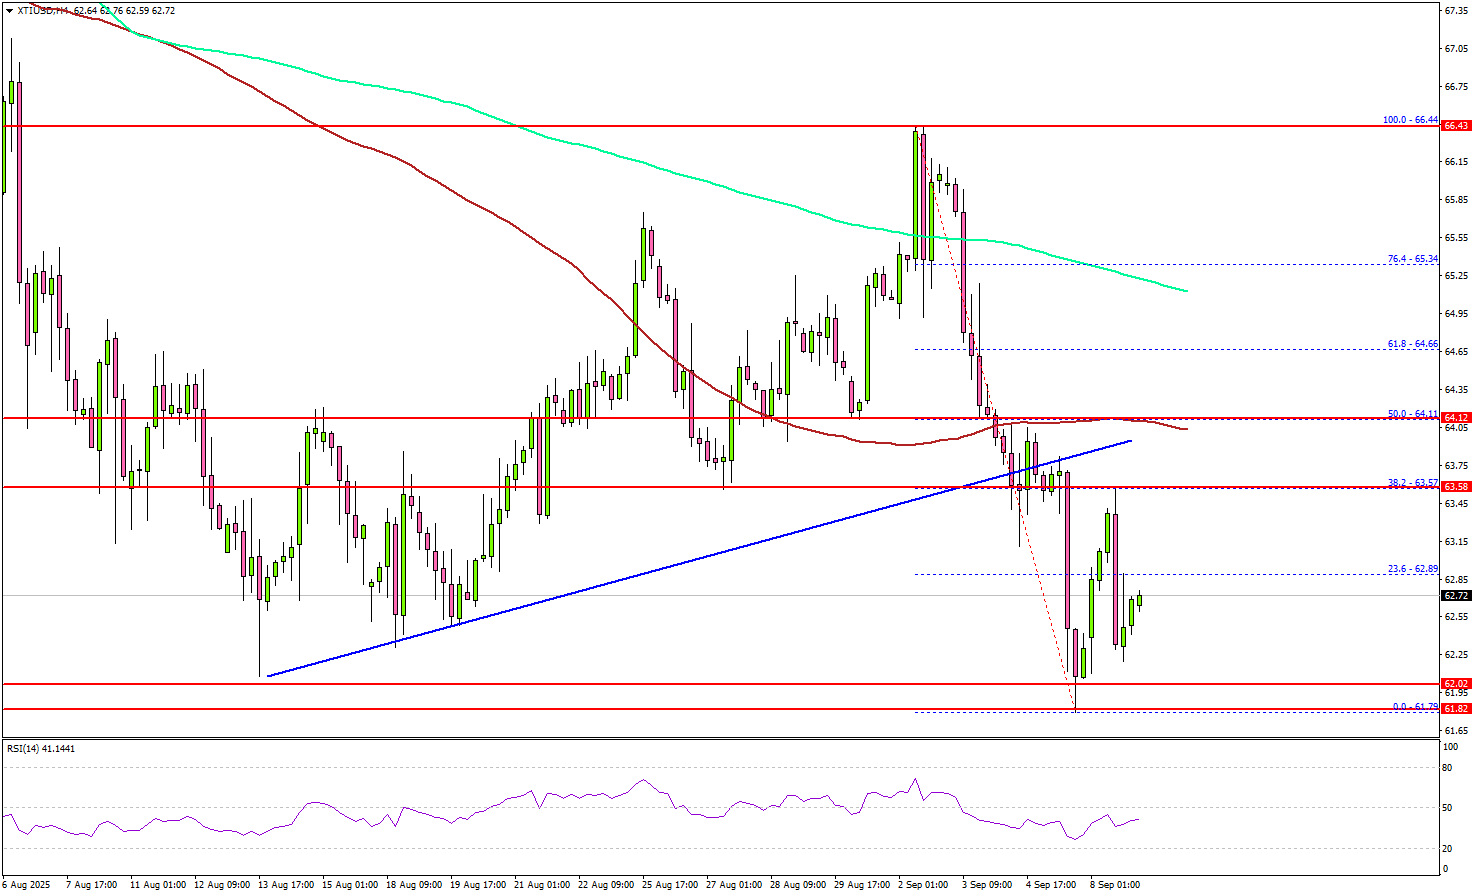
A low was formed at $61.79 before there was a minor recovery wave. However, the bears are still active below $64.00. On the upside, immediate resistance is near the $63.50 level.
The first key hurdle for the bulls could be near the 100 simple moving average (red, 4-hour) at $64.00. A close above $64.00 might send Oil prices toward the 61.8% Fib retracement level of the downward move from the $66.44 swing high to the $61.79 low at $65.35.
Any more gains might call for a test of $66.50 in the near term. On the downside, the first major support sits near the $61.80 zone. The next support could be $60.50. A daily close below $60.50 could open the doors for a larger decline.
In the stated case, the bears might aim for a drop toward $58.00. Any more losses could open the doors for a test of the $50.00 handle.
Looking at Gold, the bulls remained in action, and they pushed the price to a new all-time high above the $3,640 level.
Economic Releases to Watch Today
- NFIB Business Optimism Index for Aug 2025 – Forecast 101.0, versus 100.3 previous.
- Nonfarm Payrolls Benchmark Revision.


