
The price actions of Gold (XAU/USD) have traded sideways and managed to hold above the US$3,600 short-term pivotal support highlighted in our previous report.
The latest speculative positioning and flows data in the gold futures market and exchange-traded funds are net positive, in turn, supporting the current short-term bullish acceleration trend of Gold (XAU/USD) since the bullish breakout above its former all-time high of US$3,500 on 2 September 2025.
Let’s examine these positioning and flow data in greater detail.
Net long speculative positions in gold futures have not reached extreme levels
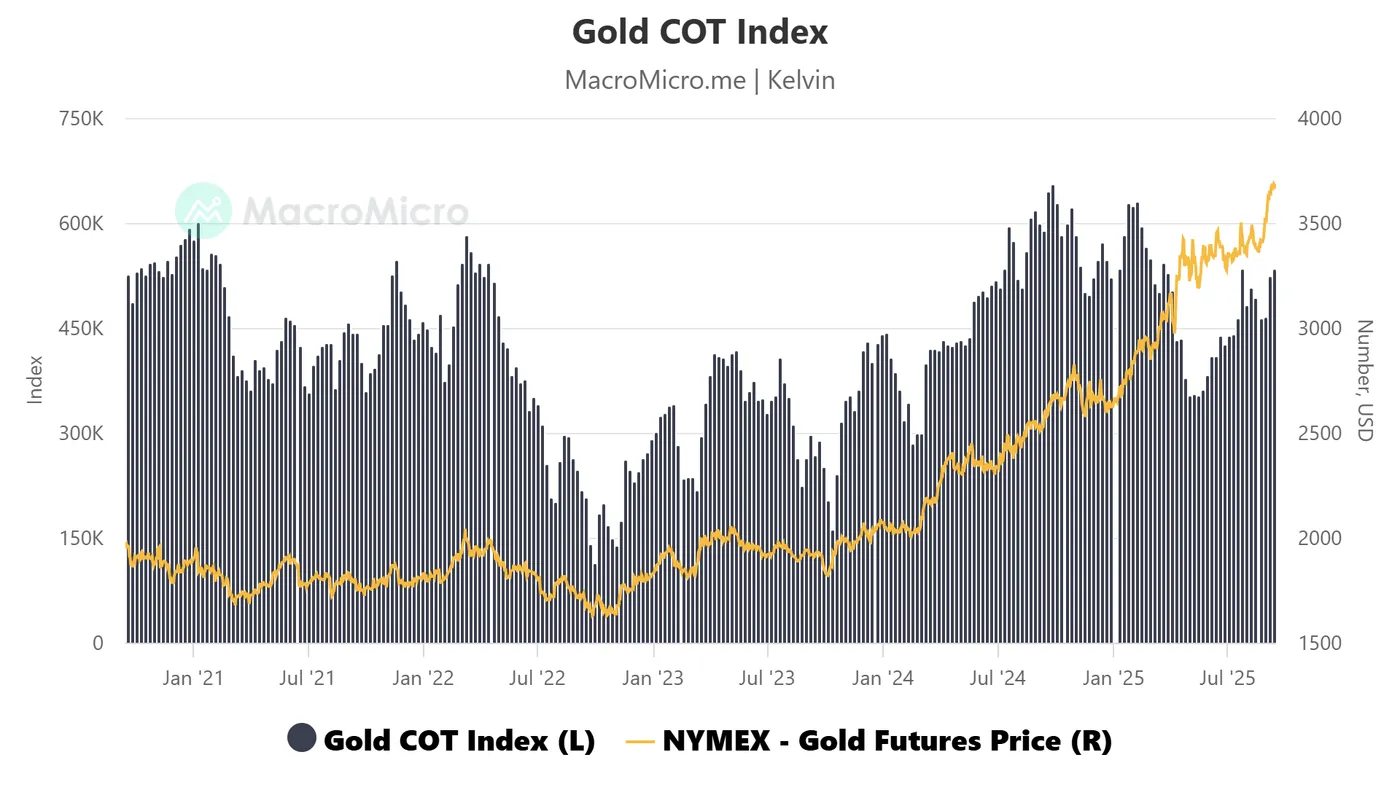
Fig. 1: Commitments of Trader large speculators’ net positioning in Gold futures as of 9 September 2025 (Source: Macro Micro)
Based on the latest Commitments of Traders (COT) data as of 9 September 2025 (compiled by MacroMicro), the aggregate net long positions of large speculators in NYMEX gold futures, after offsetting the positions of commercial hedgers, have climbed to +535,115 contracts, extending a steady four-month increase from +354,079 on 29 April 2025 (see Fig. 1).
Net speculative flows, primarily from hedge funds, are often contrarian indicators; elevated positioning can trigger an opposite move in prices if market data or news disappoints.
However, with the current net long positioning still about 20% below the five-year high of +655,096 contracts recorded on 24 September 2024, the short-term bullish trend in Gold (XAU/USD) appears to have more room to run, as positioning has yet to reach levels that typically prompt profit-taking.
Gold ETFs’ net inflows have recovered from a 2-month low
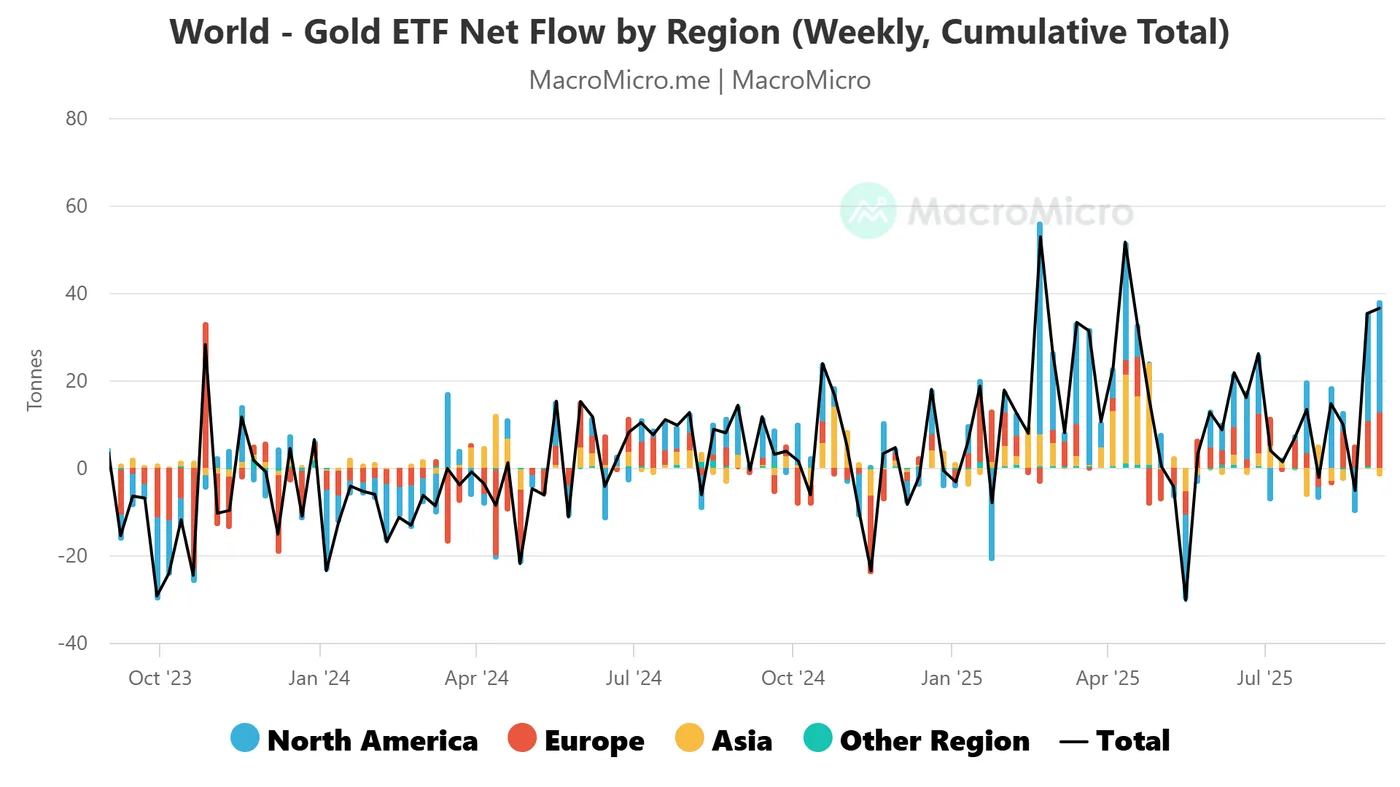
Fig. 2: Weekly cumulative Gold ETF flows as of 5 September 2025 (Source: Macro Micro)
In addition to steady gold bullion purchases by central banks since 2022, institutional and retail demand through exchange-traded funds (ETFs) has gained momentum since May 2025, further reinforcing investor appetite for the precious metal.
Total regional gold ETF flows have recovered from a net outflow of -5.17 tonnes for the week ending 22 August 2025 to a net inflow of 36.49 tonnes for the week ending 5 September 2025 (see Fig. 2).
An improvement in the cumulative weekly gold ETF flows suggests a pick-up in demand from institutions and retail investors, in turn, supporting the short to medium-term uptrend phases of Gold (XAU/USD)
Let’s now examine the short-term (1 to 3 days) trajectory of Gold (XAU/USD) and its key levels to watch ahead of this week’s key US Federal Reserve monetary policy decision, latest economic projections, and Fed Chair Powell’s press conference.
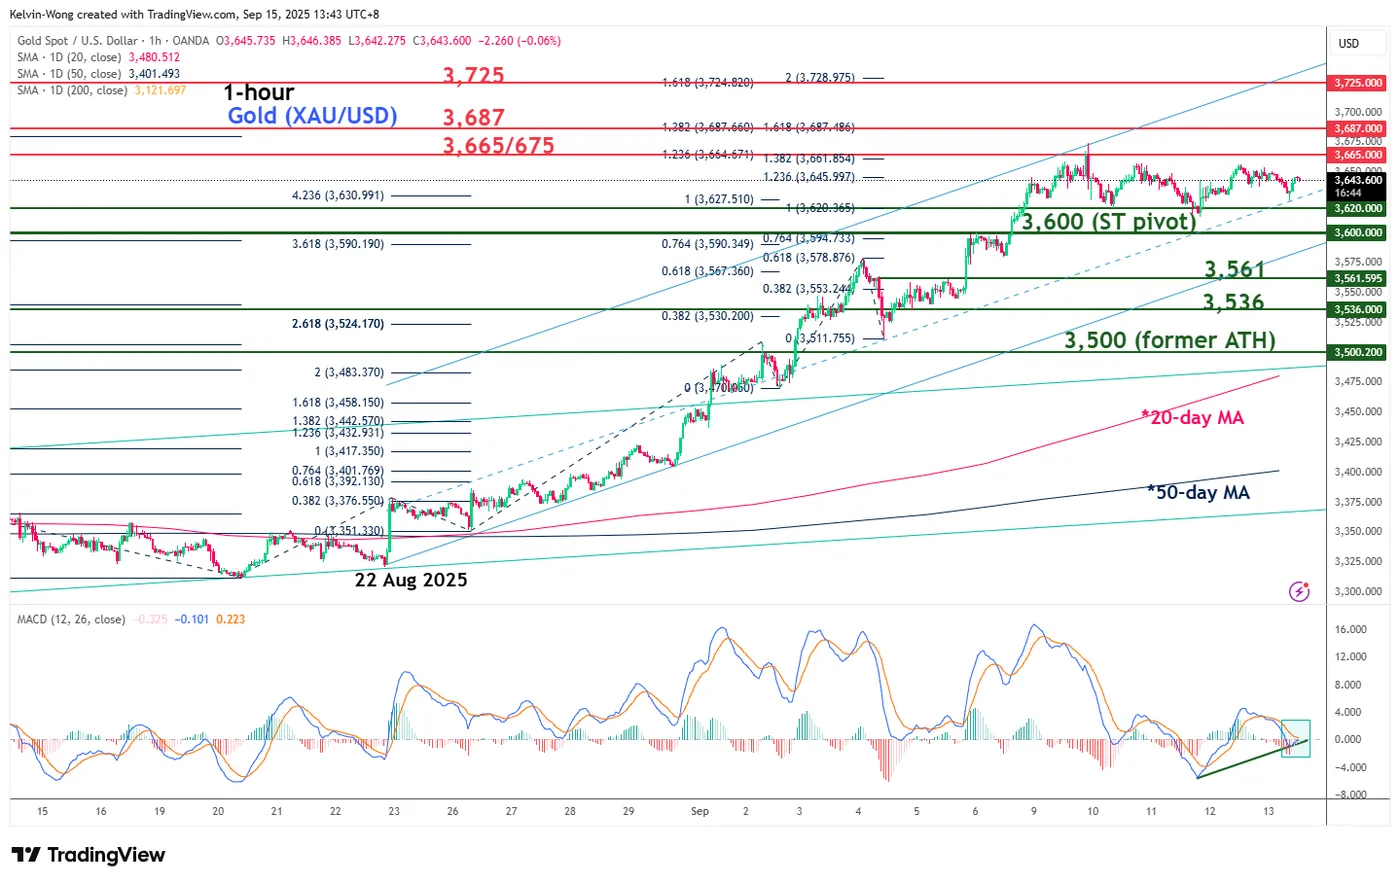
Fig. 3: Gold (XAU/USD) minor trend as of 15 September 2025 (Source: TradingView)
Preferred trend bias (1-3 days)
Maintain bullish bias with a key short-term pivotal support at US$3,600 for Gold (XAU/USD). A clearance above US$3,665/3,675 intermediate resistance increases the odds of another leg of bullish impulsive up move sequence for the next intermediate resistances to come in at US$3,687, followed by US$3,725 (also a Fibonacci extension cluster) (see Fig. 3).
Key elements
- The price actions of Gold (XAU/USD) have continued to oscillate within a minor ascending channel from its 22 August 2025 low, with its upper boundary of the ascending channel projected to come at US$3,725, and its lower boundary, now acting as a key intermediate support at US$3,600.
- The hourly MACD trend indicator has managed to find support at around the centreline, and it has now flashed out an impending bullish crossover signal. These observations suggest that the minor bullish acceleration phase for Gold (XAU/USD) remains intact.
Alternative trend bias (1 to 3 days)
A break below the US$3,600 key short-term support on Gold (XAU/USD) invalidates the bullish tone to trigger a deeper minor corrective decline towards the next intermediate supports at US$3,561 and US$3,536.


. A clearance above US$3,665/3,675 intermediate resistance increases the odds of another leg of bullish impulsive up move sequence for the next intermediate resistances to come in at US$3,687, followed by US$3,725 (also a Fibonacci extension cluster) (see Fig. 3).)