
Key takeaways
- The recent 9% rally in gold (XAU/USD) from US$3,886 to US$4,245 is likely a short-term corrective rebound within a larger medium-term downtrend after the all-time high of US$4,381 on 20 October 2025.
- Rising 10-year US Treasury real yield, which broke above 1.77% and remains supported, increases the opportunity cost of holding gold, constraining its upside momentum.
- Short-term gold is at risk of a bearish breakdown below US$4,036, with key resistance at US$4,155; a break above this level could trigger a squeeze toward US$4,203/4,267.
The recent 9% rally seen in the gold (XAU/USD) from its 28 October 2025 low of US$3,886 to last Thursday, 13 November 2025, high of US$4,245 is likely a minor corrective rebound, aka “dead cat bounce”, within a larger medium-term corrective decline structure that the precious yellow metal is likely still undergoing after gold hit its current all-time high of US$4,381 on 20 October 2025.
Let’s break it down from a technical and intermarket analysis perspective.
10-year US Treasury real yield bullish breakout above 1.78%
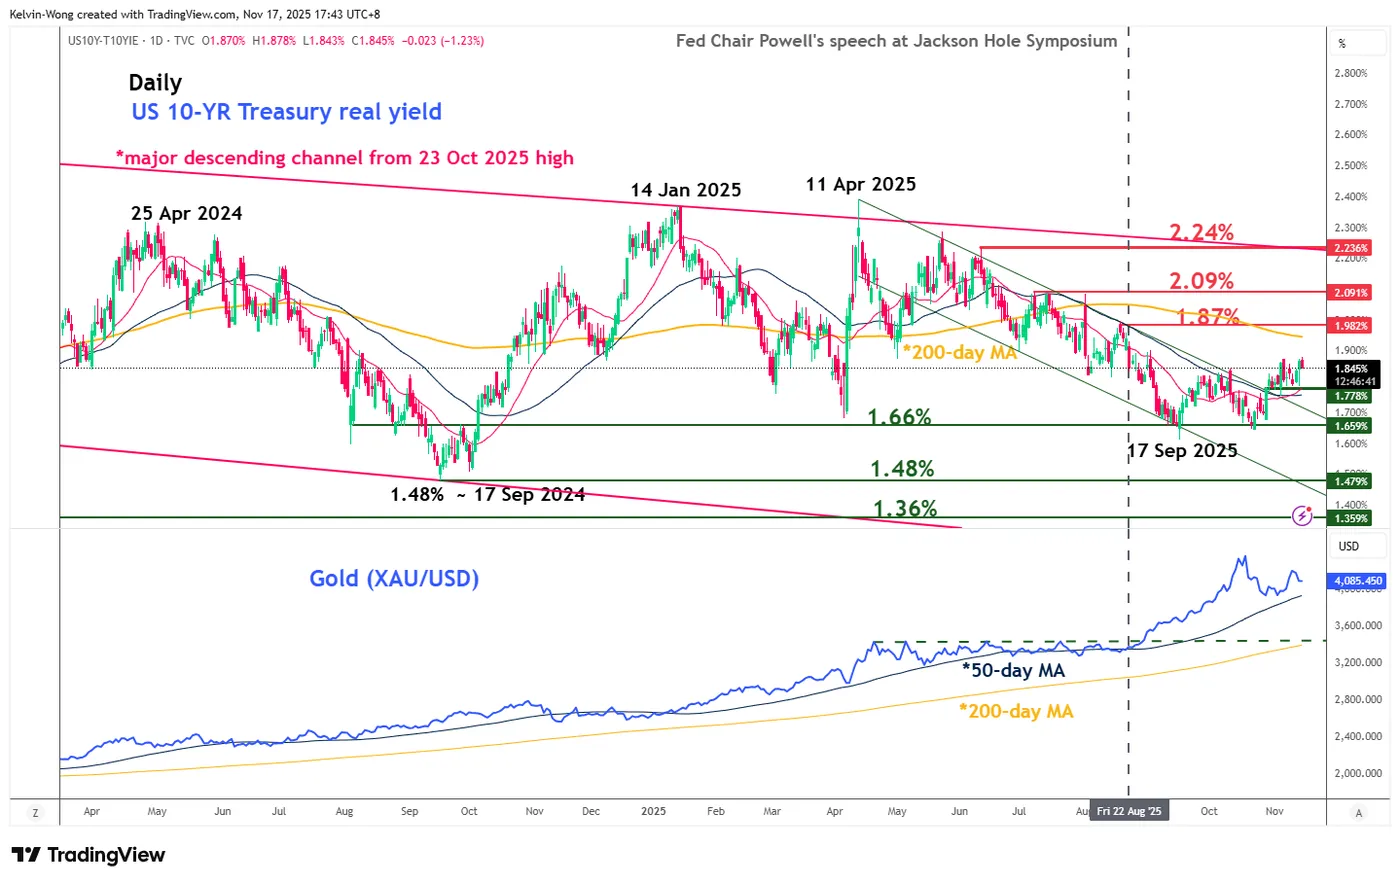
Fig. 1: 10-year US Treasury real yield medium-term & major trends as of 17 Nov 2025 (Source: TradingView)
The opportunity cost of holding gold, especially for leveraged speculative long positions, has increased in the past four weeks.
The 10-year US Treasury real yield has found medium-term support at 1.66% and broke decisively above its prior medium-term descending channel resistance at 1.77% on 30 October.
It has continued to trade firmly above 1.77% in the past two weeks, which coincides with the 20-day and 50-day moving averages.
These observations suggest that the 10-year US Treasury real yield has room for further upside within its major downtrend phase that is still intact below the major pivotal resistance of 2.24%, with the next medium-term resistances coming in at 1.87% and 2.09% (see Fig. 1).
A further rise in the 10-year US Treasury real yield raises the opportunity cost of holding gold, which could constrain upside momentum in the yellow metal.
Next, we outline the short-term trajectory for gold (XAU/USD) over the next 1 to 3 days, along with the key technical elements and levels to monitor.
Preferred trend bias (1-3 days) – At risk of bearish breakdown below US$4,036
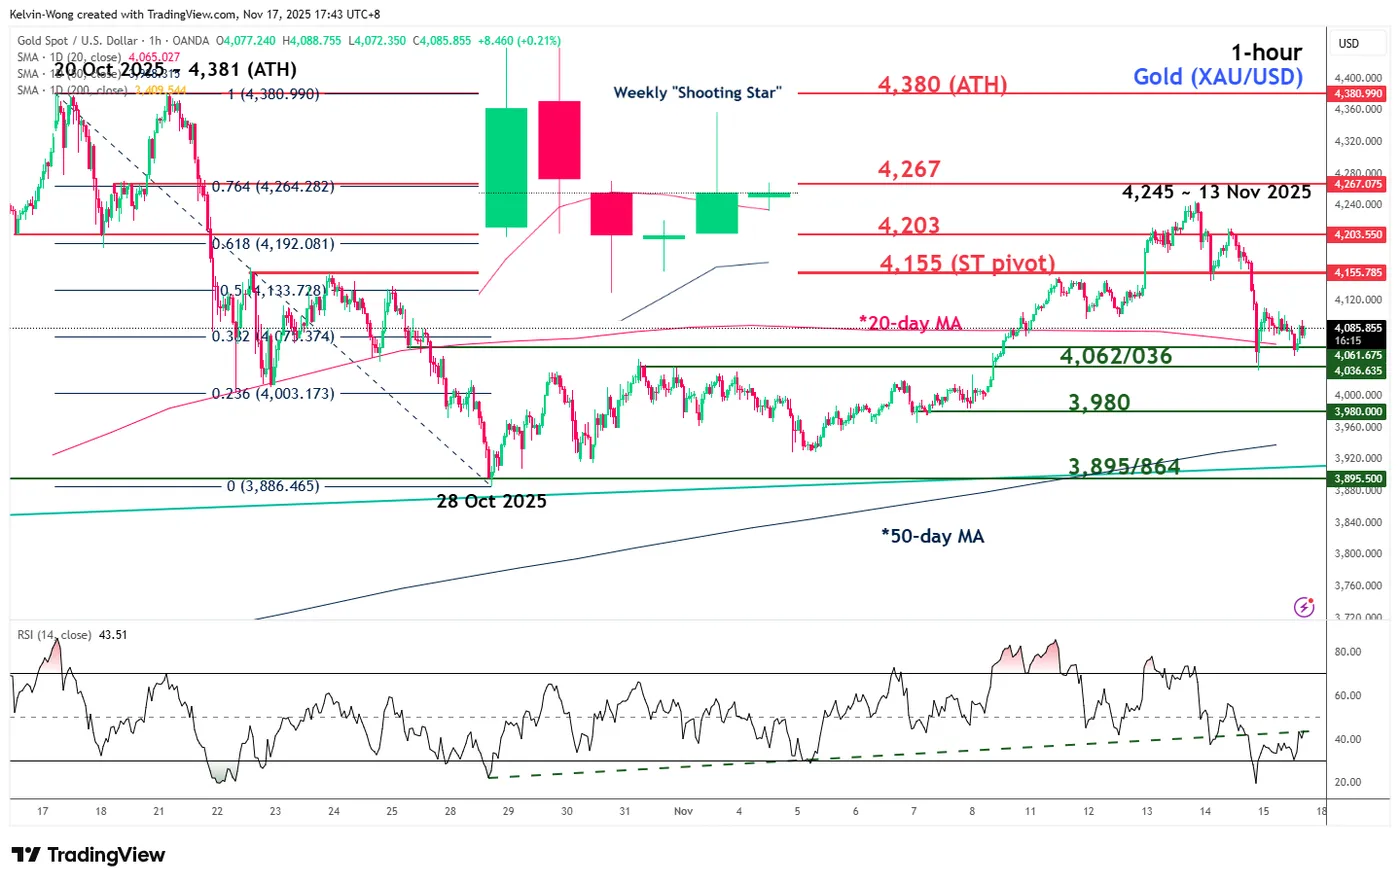
Fig. 2: Gold (XAU/USD) minor trend as of 17 Nov 2025 (Source: TradingView)
Short-term pivotal resistance for gold (XAU/USD) stands at US$4,155, and a break below US$4,036 is likely to unleash the second leg of its medium-term corrective decline phase to expose the next intermediate supports at US$3,980 and US$3,895/3,864 in the first step (see Fig. 2).
Key elements
- Gold (XAU/USD) has staged a bearish reversal on last Friday, 14 November, and ended the week with a weekly bearish “Shooting Star” candlestick pattern.
- Before the bearish reversal occurred last Friday, the hourly RSI momentum indicator of gold (XAU/USD) had traced out a bearish divergence condition at its overbought region (above the 70 level) on Thursday, 13 November.
- These observations indicate that the 9% rally in gold (XAU/USD) from the 28 October 2025 low to the 13 November 2025 high lacks the momentum needed to trigger a sustained bullish impulsive move.
Alternative trend bias (1 to 3 days)
On the other hand, a clearance above US$4,155 key resistance invalidates the bearish scenario for a squeeze up towards the next intermediate resistances at US$4,203 and US$4,267.


 from US$3,886 to US$4,245 is likely a short-term corrective rebound within a larger medium-term downtrend after the all-time high of US$4,381 on 20 October 2025.)