
Natural Gas: ⬇️ Sell
- Natural Gas falling inside impulse wave (1)
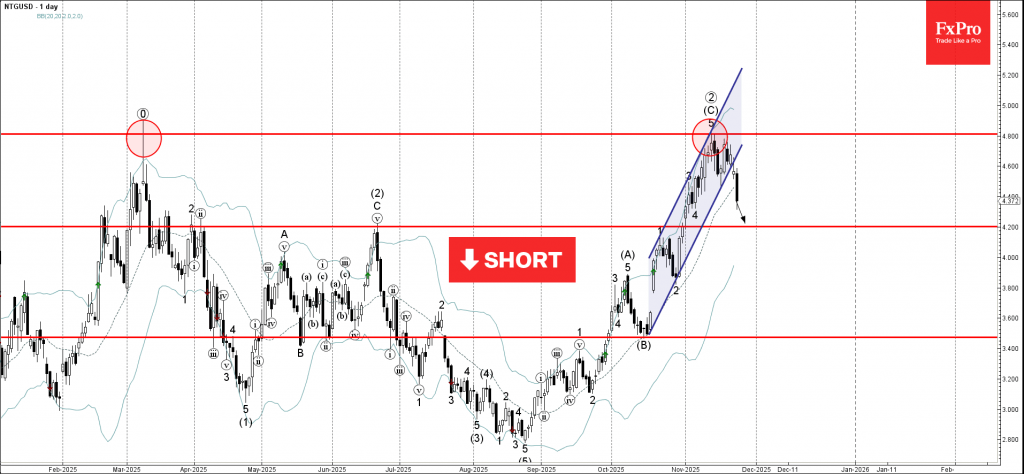
- Likely to fall to support level 4.200
Natural Gas recently reversed from resistance area between the long-term resistance level 4.800 (former top of the shooting star from May) and the upper daily Bollinger Band.
This resistance area was further strengthened by the resistance trendline of the narrow daily up channel from October.
Having just broken the aforementioned daily up channel, Natural Gas can be expected to fall further in the accelerated impulse wave (1) to the next support level 4.200.


 and the upper daily Bollinger Band.)