
Both the Nasdaq and S&P 500 saw their first red month since April 2025 in what proved to be a highly volatile trading period.
Up and down swings were a common theme as sentiment soured pre-US Government reopening before seeing a tentative improvement.
A late-month stark rebound managed to erase most of the monthly losses, but it seems that risk-appetite is catching a cold to begin the new month.
A key warning regarding last week’s rebound lies in the aggressive repricing of the Federal Reserve’s path: the probability of a 25 bps cut at the December 10th FOMC meeting surged from roughly 20% to almost 90% in just a few days.
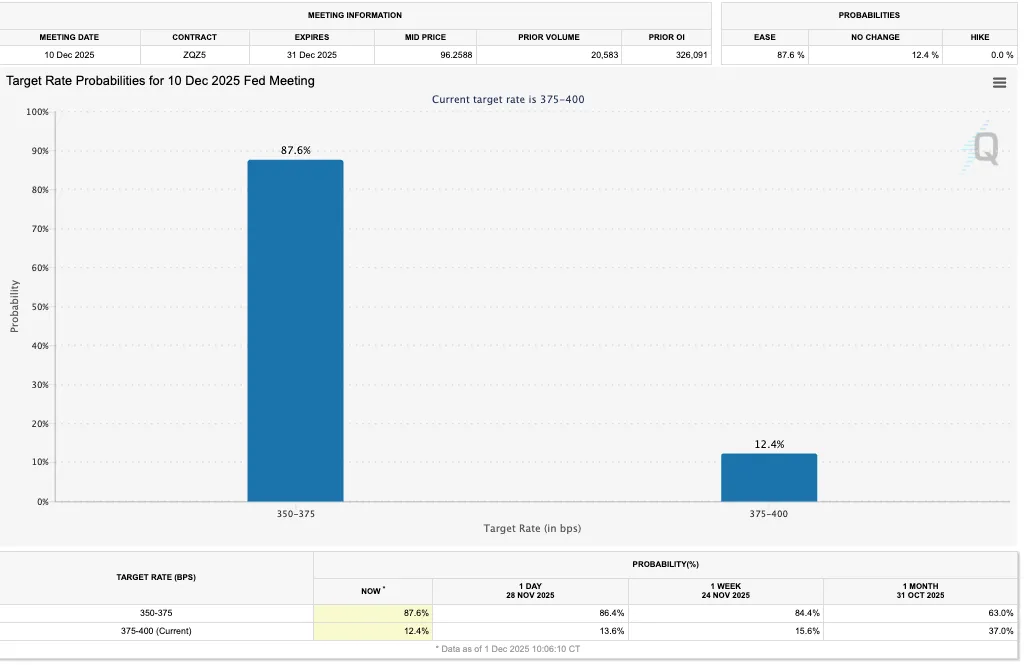
Rate Cut Pricing for the December 10 FOMC Meeting, December 1, 2025 – Source: CMEGroup
Now, while the cut is the dominant expectation, it is not a 100% certainty. The upcoming Core PCE release—the first significant inflation data since October 24th—holds the potential to disrupt this pricing.
The upside for a better pricing is limited given the cut is already at 90%, but the downside risk is significant if the data comes in hot and the cut gets priced out.
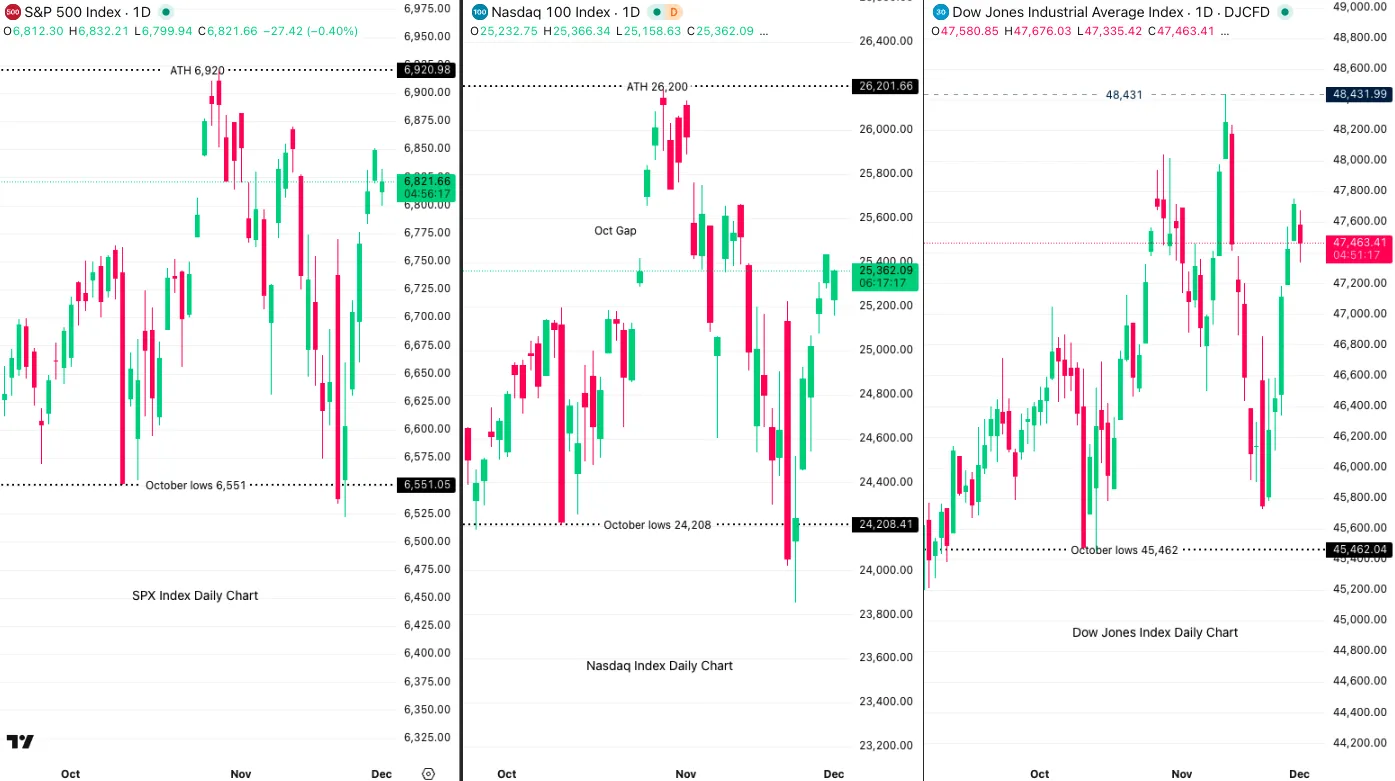
US Main Indices Daily Outlook – Lower gap but rebound. December 1, 2025 – Source: TradingView
Volumes were also notably low last week due to the Thanksgiving holiday, suggesting that many traders were waiting for liquidity to return before committing to positions, creating the conditions for a volatile market open.
In that aspect, risk assets have turned sour to start the week, with Cryptos and Tech once again leading the downside.
Indices gapped down at the open but have since pulled back higher, filling the gaps. Let’s take a close look at all the major US Indices—Dow Jones, Nasdaq, and S&P 500—and intraday charts & levels for all of them.
Stock Market Heatmap for the current session
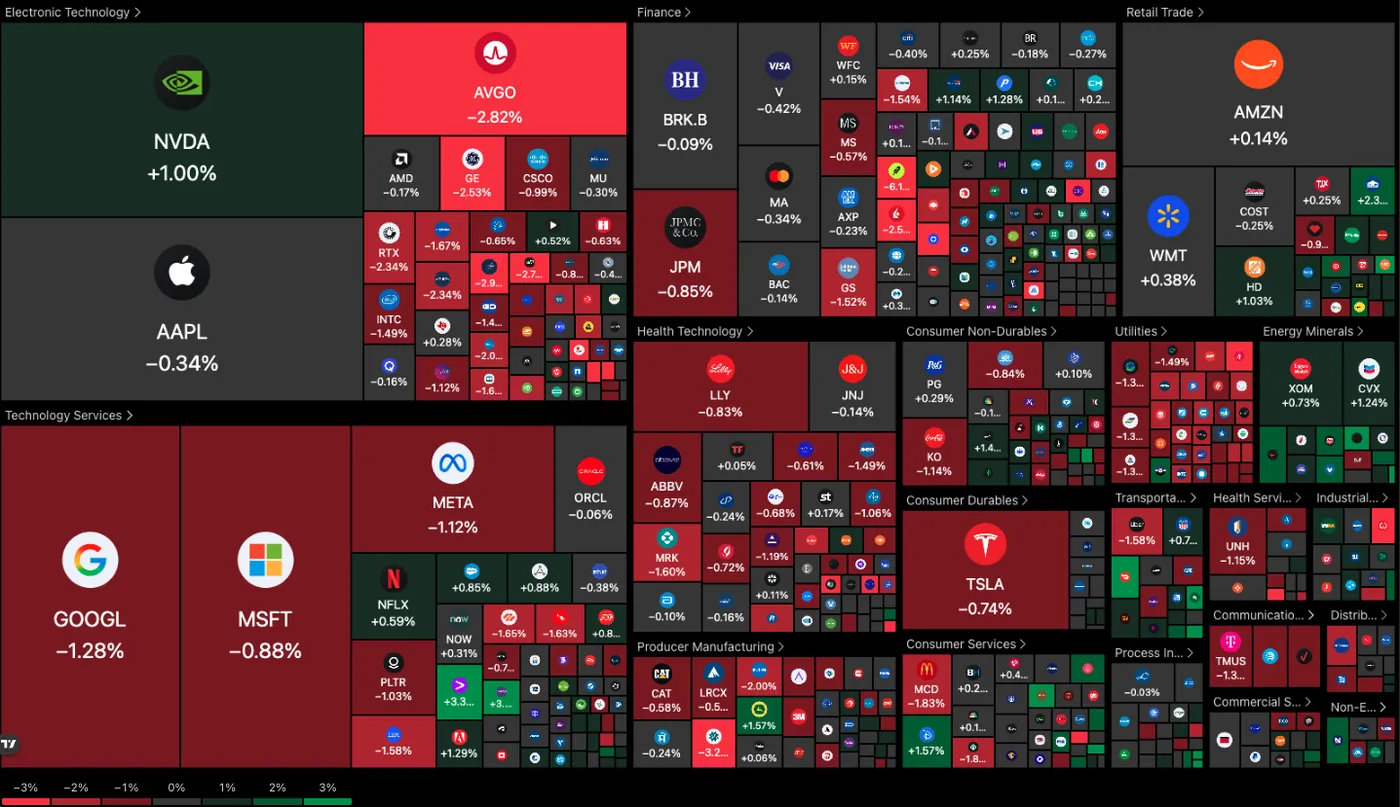
US Equity Heatmap (11:15 A.M.) – December 1, 2025 – Source: TradingView
Dow Jones 4H Chart and Technical Levels
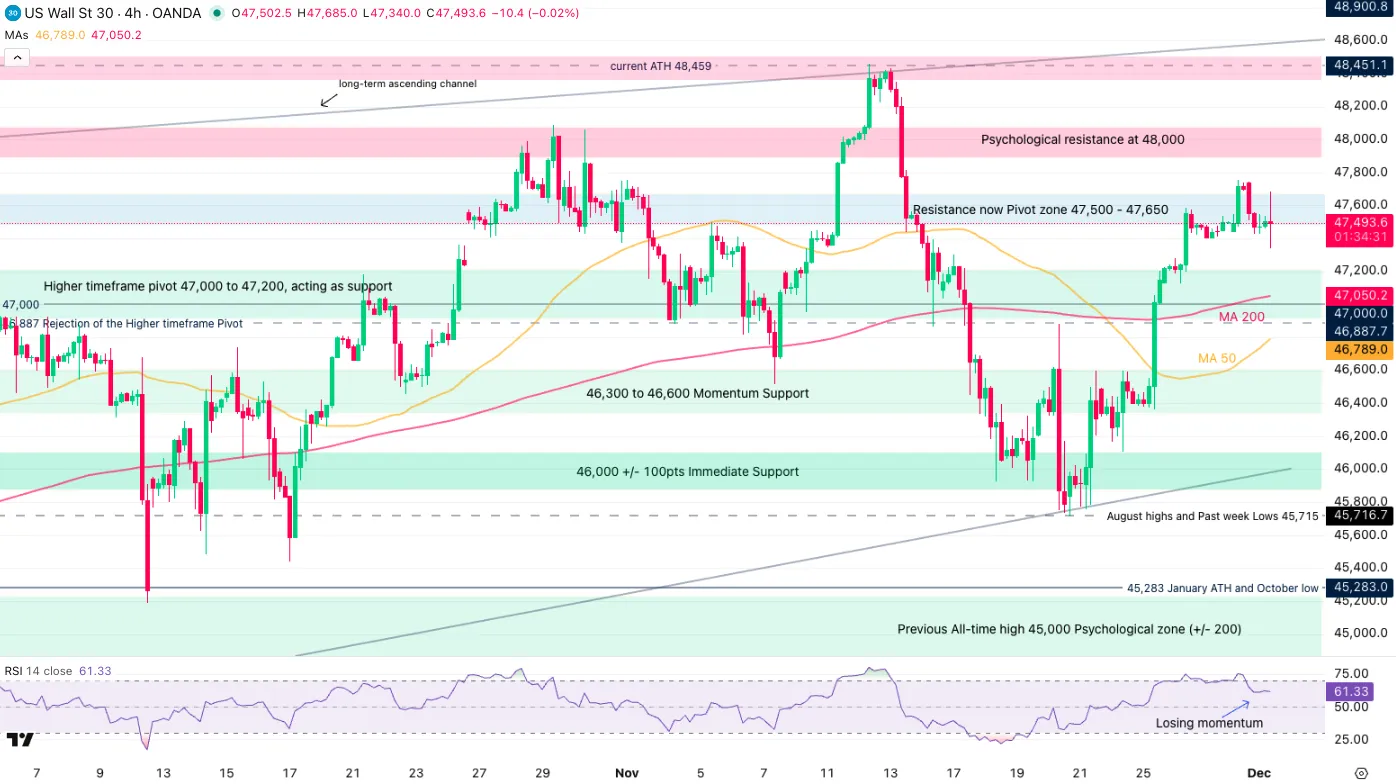
Dow Jones (CFD) 4H Chart – December 1, 2025 – Source: TradingView
The Industrial Index was the most optimistic about the dovish repricing last week, almost catching up to the 48,000 level.
It notably was the only index which finished higher last month, even if it was by a very thin margin.
Nevertheless, buyers are losing quite some steam in the Dow as mid-session flows turn back to tech, with the current candle forming a symmetrical doji – A sign of indecision. The lack of decision takes further emphasis with the RSI retracting from elevated levels back towards neutral.
The 4H picture still remains above the key 50 and 200 period Moving Averages and the 47,000 handle which is the mark to keep your eyes on to estimate appetite for risk.
For immediate momentum cues, look at the current candle highs (47,685) and lows (47,340). Watch for any break above and below for breakout trades.
Dow Jones technical levels of interest:
Resistance Levels
- Current All-time high 48,459
- Next Resistance zone 47,500 – 47,650
- Psychological resistance at 48,000
Support Levels
- Higher timeframe pivot 47,000 to 47,200
- 46,000 +/- 300pts Immediate Support
- Tuesday Lows 45,925
- 45,000 psychological level (next support and main for higher timeframe)
Nasdaq 4H Chart and Technical Levels
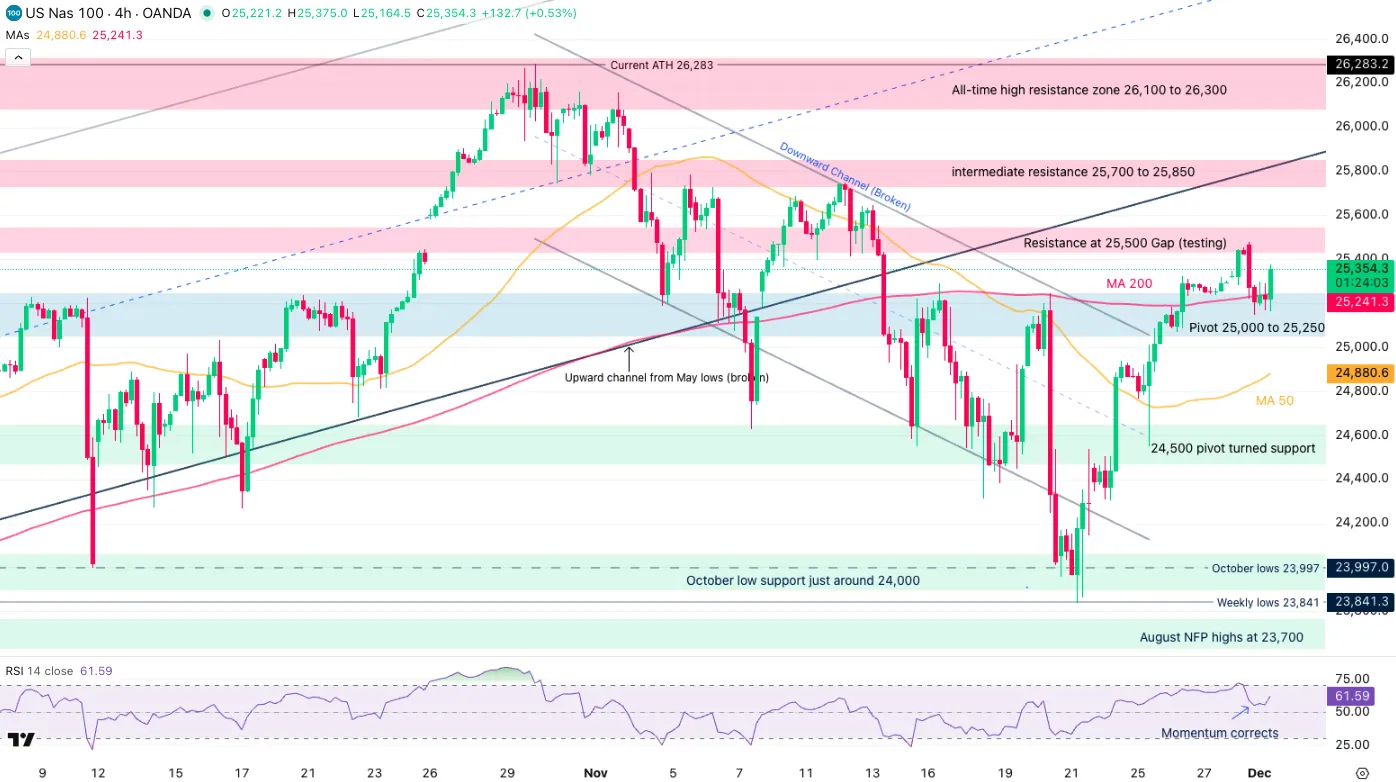
Nasdaq (CFD) 4H Chart – December 1, 2025 – Source: TradingView
Nasdaq is proving its resilience despite the outflows in tech, held by a rebound in Nvidia and a stellar past week. Dip-buyers have stepped in aggressively after the gap-down.
The mid-term picture is now much less bearish than it was in mid-November, but bulls still have work to do to retake the crown.
With the price action stuck between the Pivot and Resistance, traders can look at three scenarios:
- A consolidation between 25,000 (Pivot) to 25,500 (Resistance) until Friday’s PCE release
- A break above 25,500 pointing to a re-integration of the longer-term uptrend (broken in November)
- A break below the 25,000 Pivot Zone, indicating further rejection of the yearly highs.
Nasdaq technical levels of interest:
Resistance Levels
- Resistance 25,000 to 25,250 immediate test, MA 200 and Thursday highs
- Current ATH 26,283 (CFD)
- Intermediate resistance and 4H MA 50 25,700 to 25,850
- Mini-resistance at 25,500 Gap
Support Levels
- 24,550 Tuesday lows
- 24,500 Main support and Pivot (recent rebound)
- October lows 24,000
- Early 2025 ATH at 22,000 to 22,229 Support
S&P 500 4H Chart and Technical Levels
S&P 500 (CFD) 4H Chart, December 1, 2025 – Source: TradingView
The S&P 500 offers a very similar picture as the one in the Nasdaq, as it now holds above its Momentum pivot (6,800 +/- 15 points) but has failed to break above its short-term resistance.
Keep an eye on the daily highs (6,854) and spot if bulls actually manage to break higher.
Failing to do so will prove a lack of decision and momentum this week.
S&P 500 technical levels of interest:
Resistance Levels
- 6,930 (current All Time-Highs)
- 6,800 Psychological resistance (+/- 10 points)
- Mid-term resistance 6,860 to 6,880
- ATH Resistance 6,900 to 6,930
Support Levels
- 6,680 to 6,700 Key Support
- 6,570 to 6,600 support
- 4 H MA 50 at 6,750
- 6,490 to 6,512 Previous ATH October lows (recent lows)
- 6,400 psychological support
Safe Trades!


