
Key takeaways
Nasdaq 100 lagging but constructive: Recent underperformance reflects sector rotation rather than trend damage, with the index still within 2% of its all-time high and showing signs of bullish consolidation.
Bullish breakout setup forming: Holding above 25,350 support keeps the near-term bias positive, while a break above 25,760/25,830 would open upside toward 26,107 and the record high.
Momentum turning supportive: Higher lows, a rebound above key moving averages, and improving RSI dynamics reinforce the case for a fresh impulsive up move.
The technology-heavy Nasdaq 100 has been the laggard in the past five trading sessions among the major US stock indices due to sector rotation towards the laggards (Dow Jones Industrial Average and small-caps Russell 2000) due to overvaluation fears in Artificial Intelligence (AI) related mega-cap technology stocks that are heavily weighted in the Nasdaq 100
The Nasdaq 100 is still trailing around 2% below from its current all-time high printed in late October 2025, whereas the Dow Jones Industrial Average and S&P 500 have rallied to fresh all-time highs on Tuesday, 6 January 2025, with the Russell 2000 just a whisker of 0.6% away from its record high reached on 11 December 2025.
Interestingly, technical analysis suggests that the Nasdaq 100 is now forming a potential bullish consolidation to kickstart a fresh impulsive up move sequence.
Short-term trend bias (1 to 3 days): Bullish breakout from 8/12 December 2025 range top
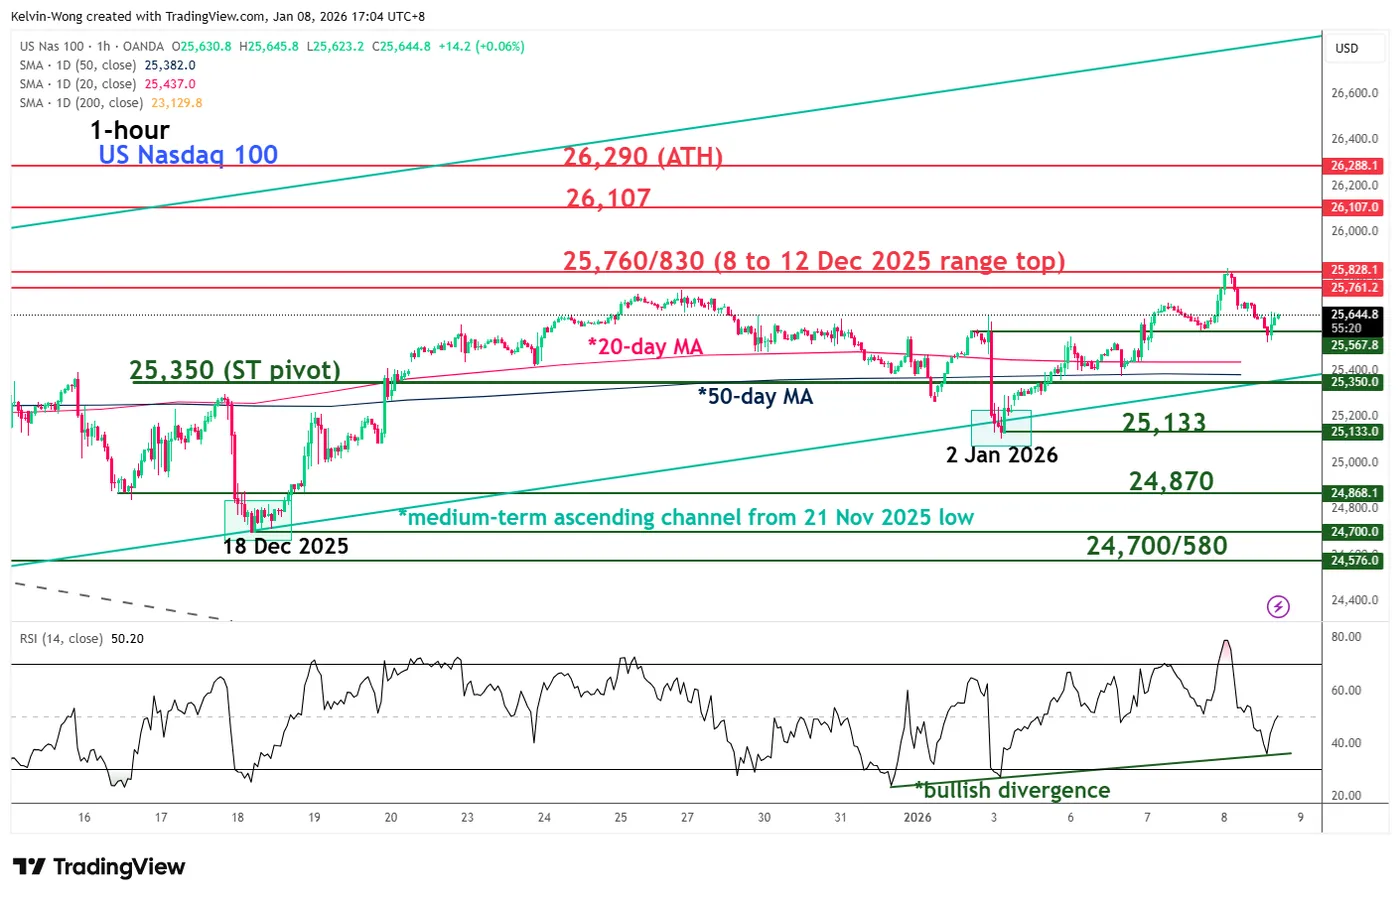
Fig. 1: US Nasdaq 100 CFD index minor trend as of 8 Jan 2026 (Source: TradingView)
25,350 key short-term pivotal support to watch on the US Nasdaq 100 CFD index (a proxy of the Nasdaq 100 E-mini futures) to maintain the potential bullish bias.
A clearance above 25,760/25,830 triggers a minor bullish breakout towards the next intermediate resistances at 26,107 and 26,290 (current all-time high area of 30 October 2025) in the first step.
Key elements to support the bullish bias
- Recent price actions of the US Nasdaq 100 CFD index have retested the lower boundary of the medium-term ascending channel twice (18 December 2025 and 2 January 2026) and formed a higher low with a reintegration back above its 20-day and 50-day moving averages.
- The hourly RSI momentum indicator has managed to stage a rebound today after a retest of a key ascending trendline support that formed an earlier bullish divergence condition at its oversold region on 2 January 2026.
Alternative trend bias (1 to days)
A break with an hourly close below 25,350 key short-term support invalidates the bullish tone for another round of choppy corrective decline to expose the next intermediate supports of 25,133, 24,870, and 24,700/24,580.


