
- Oil explodes higher from Iran tensions and supply fears
- Exploring Technical Analysis for a rally in the commodity
- WTI faces headwinds of catalysts across the globe, with Venezuela and the Middle East
2026 is shaping up to be a chaotic year for traders.
Between record corporate issuance signaling high-paced economic activity, the US capture of a head of state in Venezuela (combined with threats to other nations), and now revolts in Iran, geopolitics has firmly taken the lead in driving volatility.
Our recent edition on Black Gold suggested that despite higher supply expectations following the Maduro capture—which pointed toward better exploitation of Venezuela’s vast reserves—structural catalysts would emerge to prevent a slide to fresh 2025-2026 lows.
And emerge they did.
The biggest catalyst, of course, is the turmoil in Iran.
Despite sanctions from OECD countries, Iran remains a critical supplier to the world’s largest consumers, particularly China, which regularly absorbs 80% to 90% of the nation’s ~4M barrels per day production.
The risk premium, however, extends beyond simple production figures which haven’t shown much change for now.
Iran holds immense strategic leverage over the Strait of Hormuz, a choke point they have used to block oil tankers and global sea traffic in the past.
This threat adds a geographic premium to the price of every barrel, even if domestic production continues uninterrupted.
Looking back to the “12-Day War,” WTI surged from $62 to $76 in a matter of days. With that precedent in mind, traders are actively positioning themselves for a potential price explosion.
Looking back to the 1979 revolution, participants fear that Oil workers may join the Revolt, as the Iranian government already killed an estimated +10,000 civilians in the protests.
Let’s dive into a multi-timeframe analysis of the WTI (US) Oil to determine if technicals point to continued upside or if prices are approaching relative extremes.
US Oil Multi-Timeframe Analysis
WTI Daily Chart
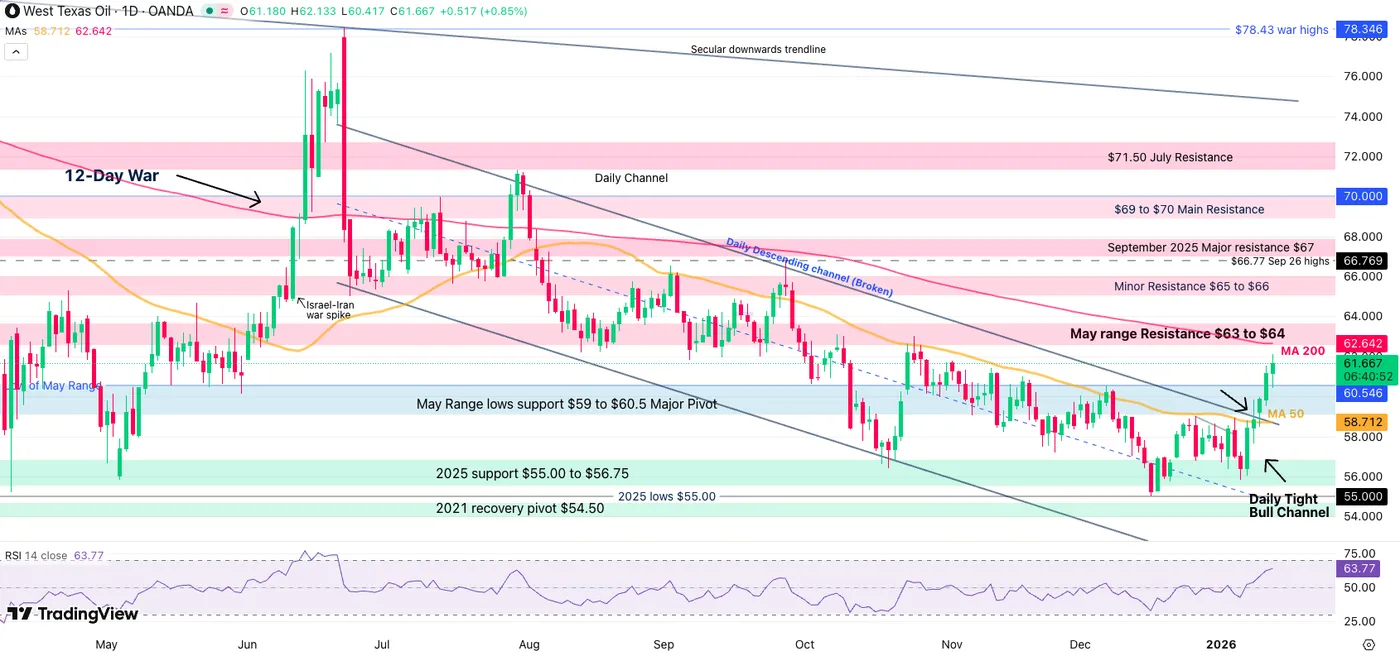
WTI Oil Daily Chart – January 14, 2026. Source: TradingView
WTI has officially broken out of its major descending channel that led the price action from after the 12-War to the current rally.
Now forming a tight-bull daily channel, bears have disappeared from the immediate action as the risk-premium takes over.
A tight bull channel occurs when green candles succeed one after the other. The pattern breaks if a bear candle closes below the previous.
There won’t be anything to stop the rally until the 200-Day Moving Average at $62.43.
To see what the next step will be:
- Can bulls manage a break above the 200-Day MA? To assume so, look for a daily close above the indicator
- A break without retest would point to even more bull pressure
- Will sellers re-appear at the MA? If they do so, look for long entries at the Pivot Zone retest ($60.00 to $60.50)
WTI 4H Chart and Technical Levels
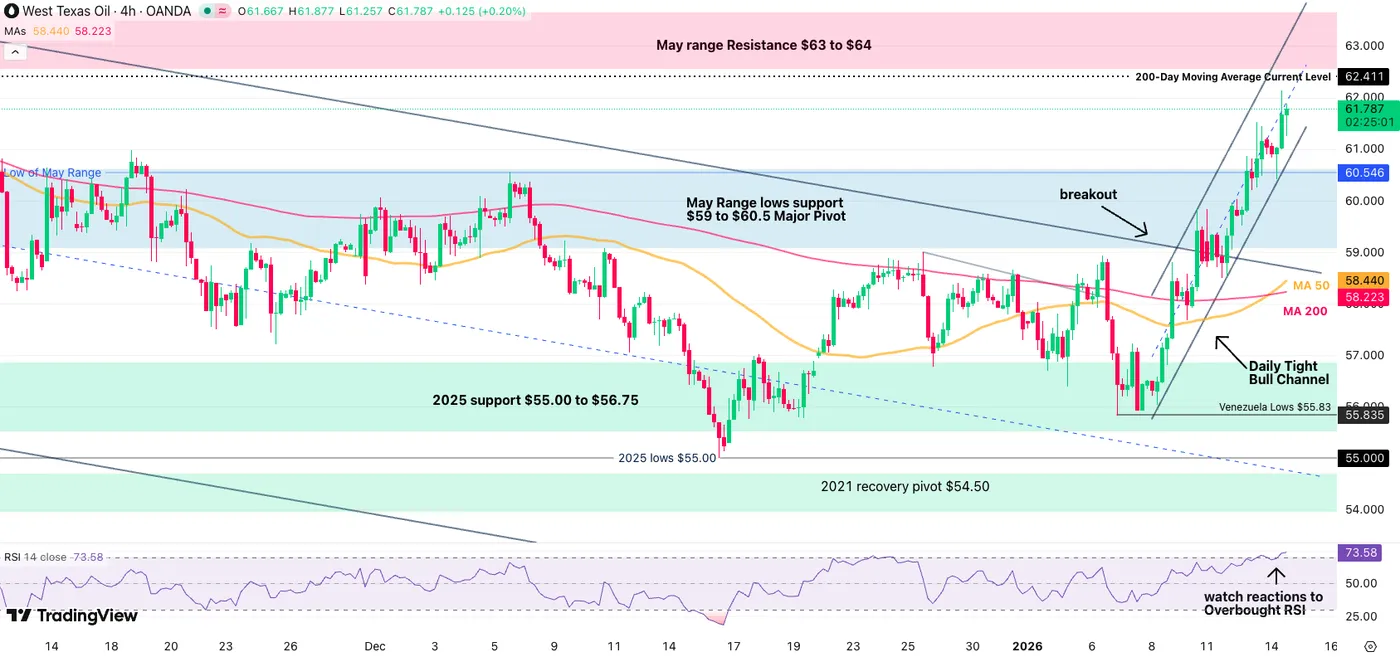
WTI Oil 4H Chart – January 14, 2026. Source: TradingView
Reactions will be interesting around here as the price action reaches overbought levels on the 4H RSI.
The morning rally is stalling slightly which prompts either consolidation or retracement – No retracements hints at further one-way continuation.
In the event of a correction, look at $60.80 for short-term entries, lows of the Tight Bull Channel.
WTI Technical Levels
Levels to place on your WTI charts:
Resistance Levels
- $62.13 Session Highs
- $62.43 200-Day MA (to break for real breakout)
- Next Resistance May 2025 Range $63 to $64
- Key September Resistance $65 to $66
Support Levels
- $60.80 Aggressive Support (intraday)
- $60.50 Pivot Zone retest Support
- $59 Pivot Zone lows
- $55 to $56.50 2025 Support and Channel lows
30M Chart and Trading Setups
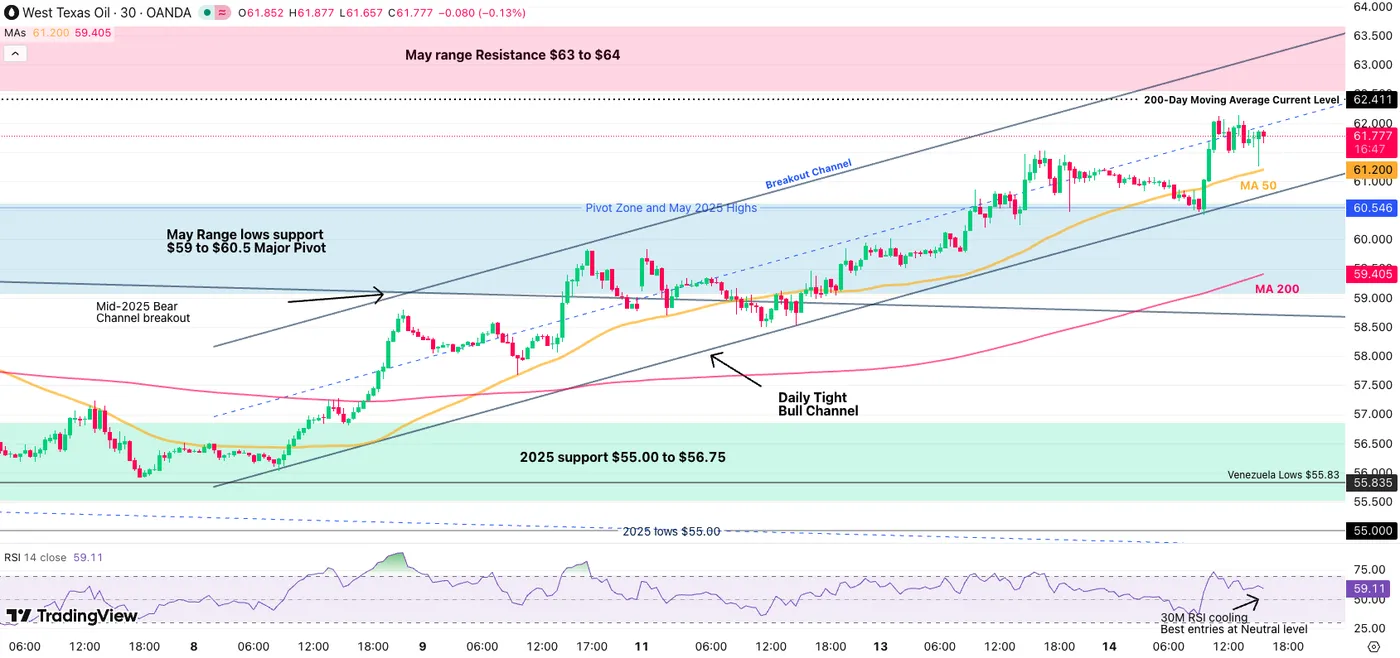
WTI Oil 30M Chart – January 14, 2026. Source: TradingView
The rally is stalling and consolidating at its relative highs.
With the action rangebound on short-timeframes, remain patient for these three signs:
- 30M RSI corrects back to the Neutral Level (40)
- Bulls manage to break above session highs ($62.13) with volume, pointing to a 200-Day MA test – Very bullish above
- Breaks manage a correction to $60.80
- Breaking below would lead at least to $60.00
Safe Trades and Stay in Touch with the Latest News!


