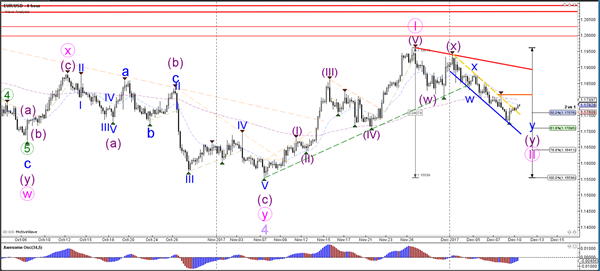
Currency pair EUR/USD
The EUR/USD broke above the resistance of the bearish trend channel (dotted yellow) but still has horizontal resistance (orange) nearby. A bearish bounce at that resistance could indicate a continuation of the wave 1-2 (pink) whereas a bullish breakout could indicate that wave 2 (pink) is completed.
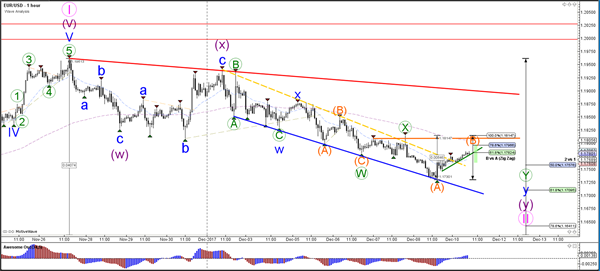
The EUR/USD has bounced at the 50% Fibonacci level of wave 2 vs 1 but is now approaching a potential resistance zone with the Fibonacci levels of wave B vs A (orange).
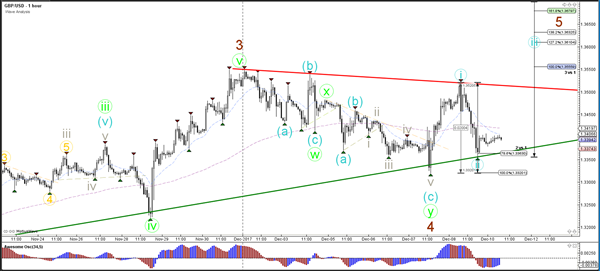
Currency pair GBP/USD
The GBP/USD bounced at the Fibonacci levels of wave 4 vs 3 (brown) and the support trend line (green) but was not able to break above the resistance trend line (red). A break below the current support (green) could still belong to a wave 4 (brown) as long as price does not break below the top of wave 1 (blue line).The GBP/USD could be building a wave 1-2 (blue) if price stays above the 100% Fibonacci level of wave 2 vs 1.
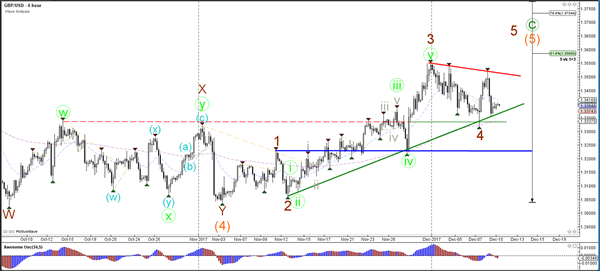
The GBP/USD could be building a wave 1-2 (blue) if price stays above the 100% Fibonacci level of wave 2 vs 1.
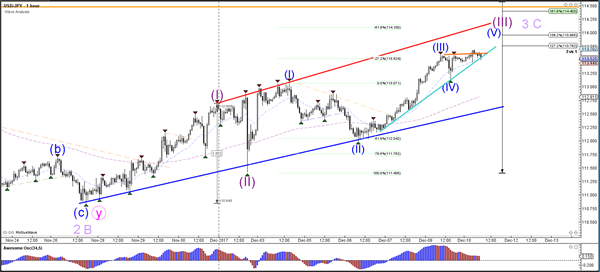
Currency pair USD/JPY
The USD/JPY broke above the resistance trend line (dotted orange) and is building bullish momentum towards the wave 3 (purple) Fibonacci targets.
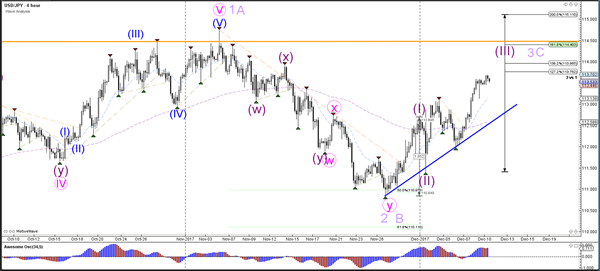
The USD/JPY showed a bullish bounce as a part of a potential wave 4 (blue). Price could break above the resistance (orange) as part of the uptrend continuation or challenge the bottom of wave 4 (blue).