
In case you missed the headlines, the attention quickly shifted from a potential intervention in Iran to heightened US threats to acquire Greenland by purchase.
After the threats over the weekend, EU heads of state are planning an emergency meeting, even as the World Economic Forum in Davos begins.
The recent geopolitical intimidation against Denmark and Greenland, combined with additional economic warnings, has prompted the European Union to raise the current 15% tariff rate by 10% if the European Union disagrees, starting February 1.
Despite American Markets being closed today for MLK Day, US assets have sold off quite harshly, with the latest tariff and general Trump volatility hurting the US Dollar.
On the other hand, the European Central Bank is consolidating its power and stability as Vice President de Guindos officially steps down, with hawk-leaning Croatian Governor Boris Vujcic selected as his replacement.
With the latest events and flows, EUR/USD is breaking to the upside and could attract quite a bit of attention (and volatility) for the times to come – keep a close eye on these developments.
In the meantime, let’s dive into a multi-timeframe EUR/USD technical analysis.
EUR/USD Multi-timeframe Technical Analysis
Daily Chart
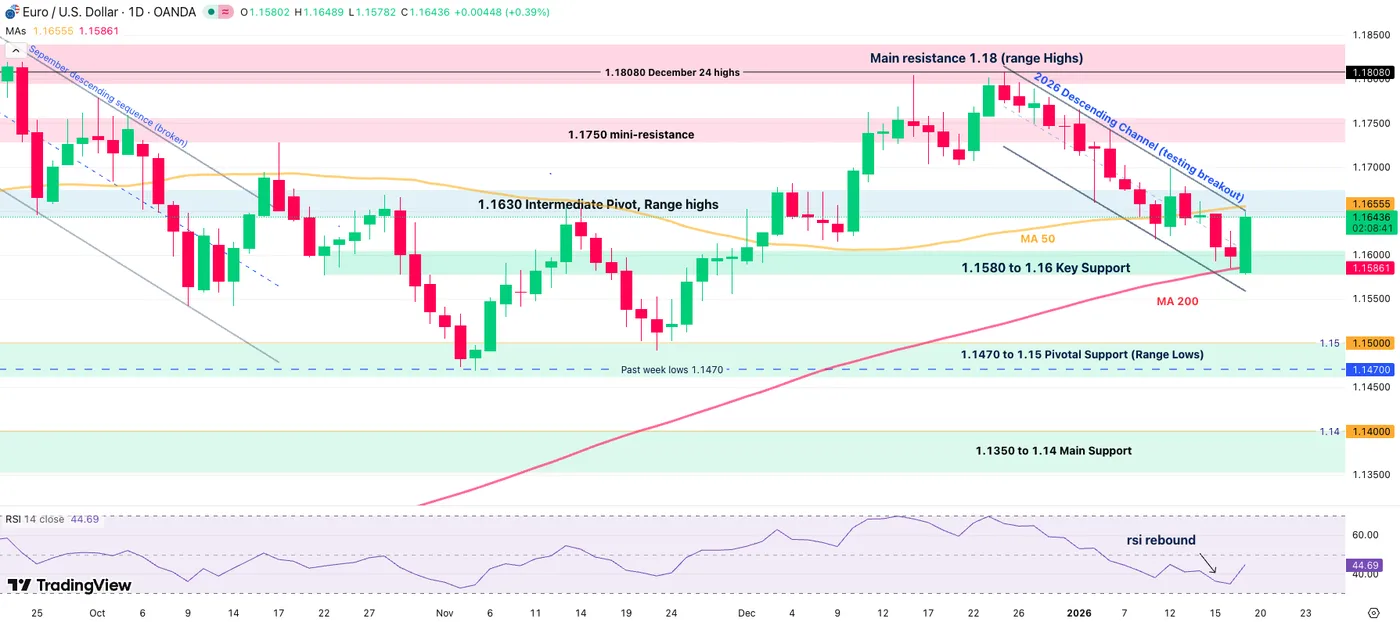
EUR/USD Daily Chart, January 19, 2026 – Source: TradingView
EUR/USD is attempting an upside breakout from its end-2025 Descending Channel.
Bouncing off of its 200-Day Moving Average (which just caught up from the 10% 2025 rally in the pair), the immediate flows and events could cause a larger breakout from its 6-month long 4,000 pip consolidation.
Several hurdles will need to be breached before that.
- The immediate test comes around 1.1630 which acts as key momentum pivot and coincides with the actual breakout from the Channel.
- Breaking and closing 1.18 on the weekly could test the 1.20 levels – Such developments would take more time
- Such scenarios exclude a potential Trump TACO where he backs off of his recent words ~ The best scenario for the USD
4H Chart and Technical Levels
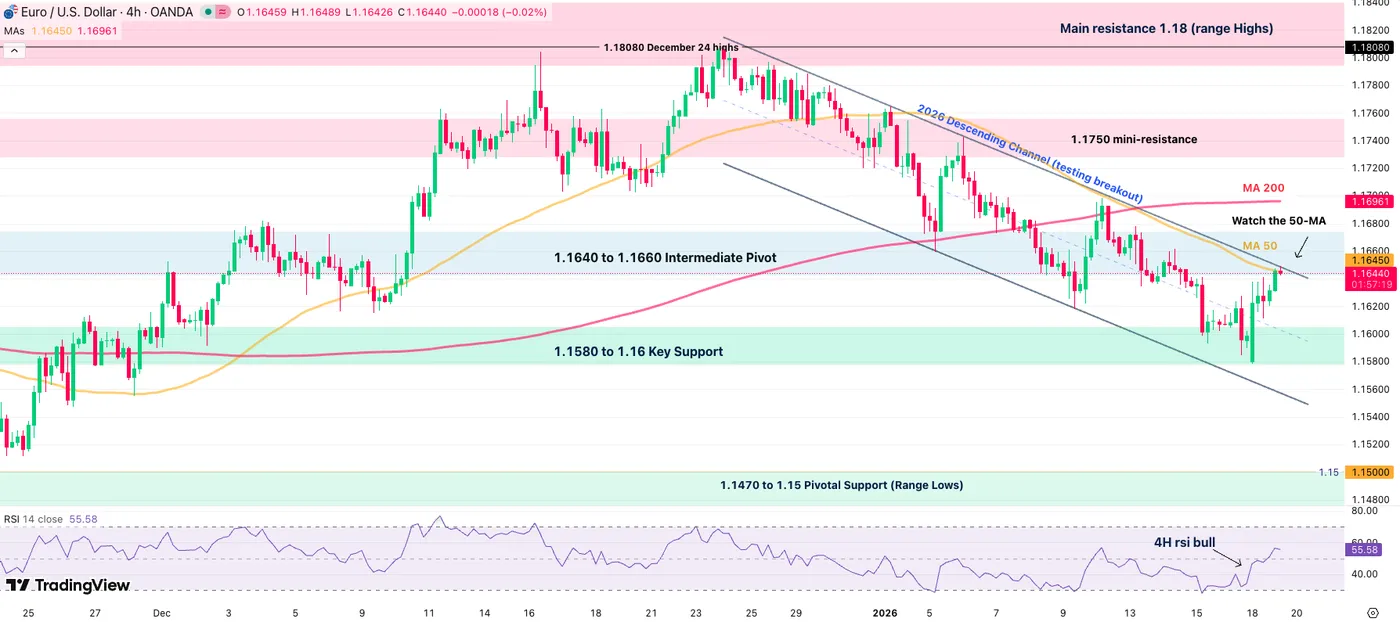
EUR/USD 4H Chart, January 19, 2026 – Source: TradingView
Watch if tomorrow closes above or below the 4H-50 MA to confirm a breakout or rejection of the Channel higher bound.
Resistance levels
- 1.1640 to 1.1660 Intermediate Pivot and 4H 50-MA (1.16490)
- 1.17 Psychological Level
- 1.1750 minor resistance
- Main resistance 1.18 (range Highs)
Support levels
- 1.1580 to 1.16 Key Support
- 1.1550 Channel lows
- 1.1470 to 1.15 Pivotal Support (Range Lows)
1H Chart
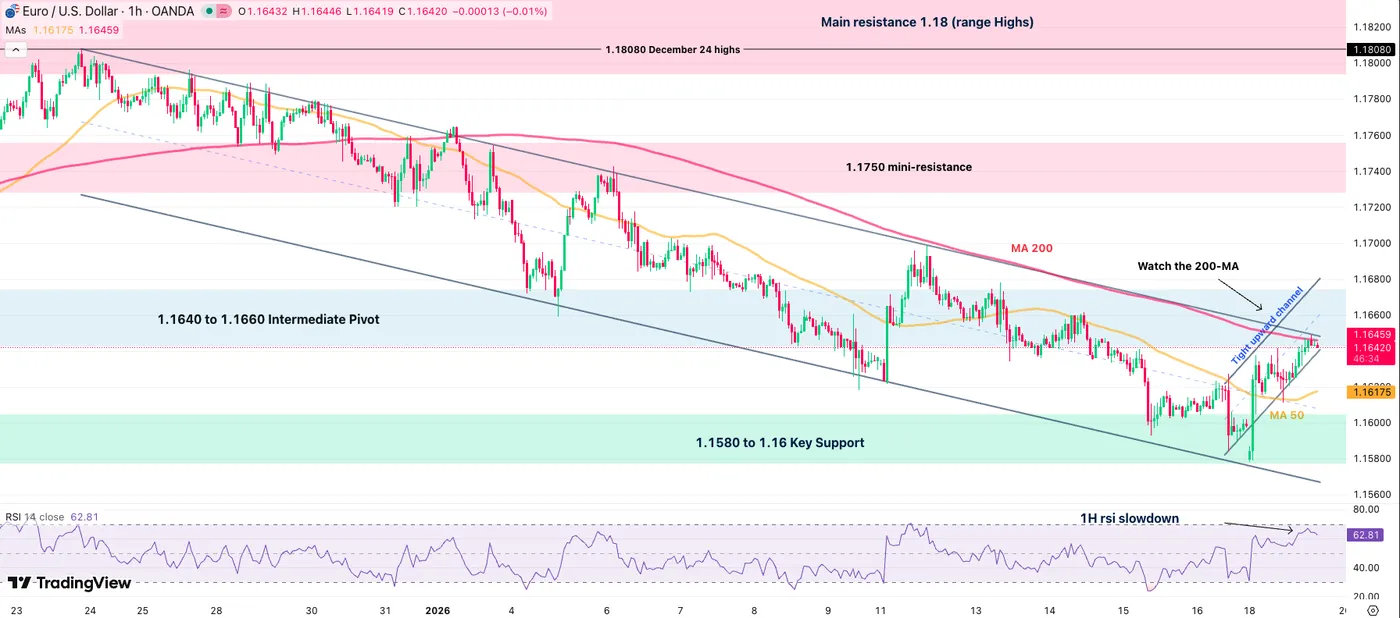
EUR/USD 1H Chart, January 19, 2026 – Source: TradingView
EUR/USD shows a more balanced price action as volumes largely fall off (US Traders are off).
It will be very interesting to see whether bulls push for a (descending) channel breakout or the 1H 200 MA/4H 50 MA stalls the price action.
Rejecting the channel highs would point either to a retest of Sunday lows or (1.15780) or continued downside (lower odds looking at the current situation).
Note: The Euro could still be affected negatively from the current development, reason why the Swiss Franc is leading the daily FX flows.
Safe Trades!


 for the times to come – keep a close eye on these developments.)