
Key Highlights
- Gold nosedived below $5,000 before it found support at $4,400.
- It could now face hurdles near $4,850 and $5,000 on the 4-hour chart.
- WTI Crude Oil prices also corrected some gains from $66.50.
- USD/JPY started a recovery wave above 153.75 and 154.50.
Gold Price Technical Analysis
Gold extended its rally to $5,598 against the US Dollar before witnessing a major decline. The price tested the $4,400 zone and recently started a recovery wave.
The 4-hour chart of XAU/USD indicates that the price traded as low as $4,401 and recently started a recovery wave above the 200 Simple Moving Average (green, 4 hours). The price climbed above the 23.6% Fib retracement level of the downward move from the $5,598 swing high to the $4,401 low.
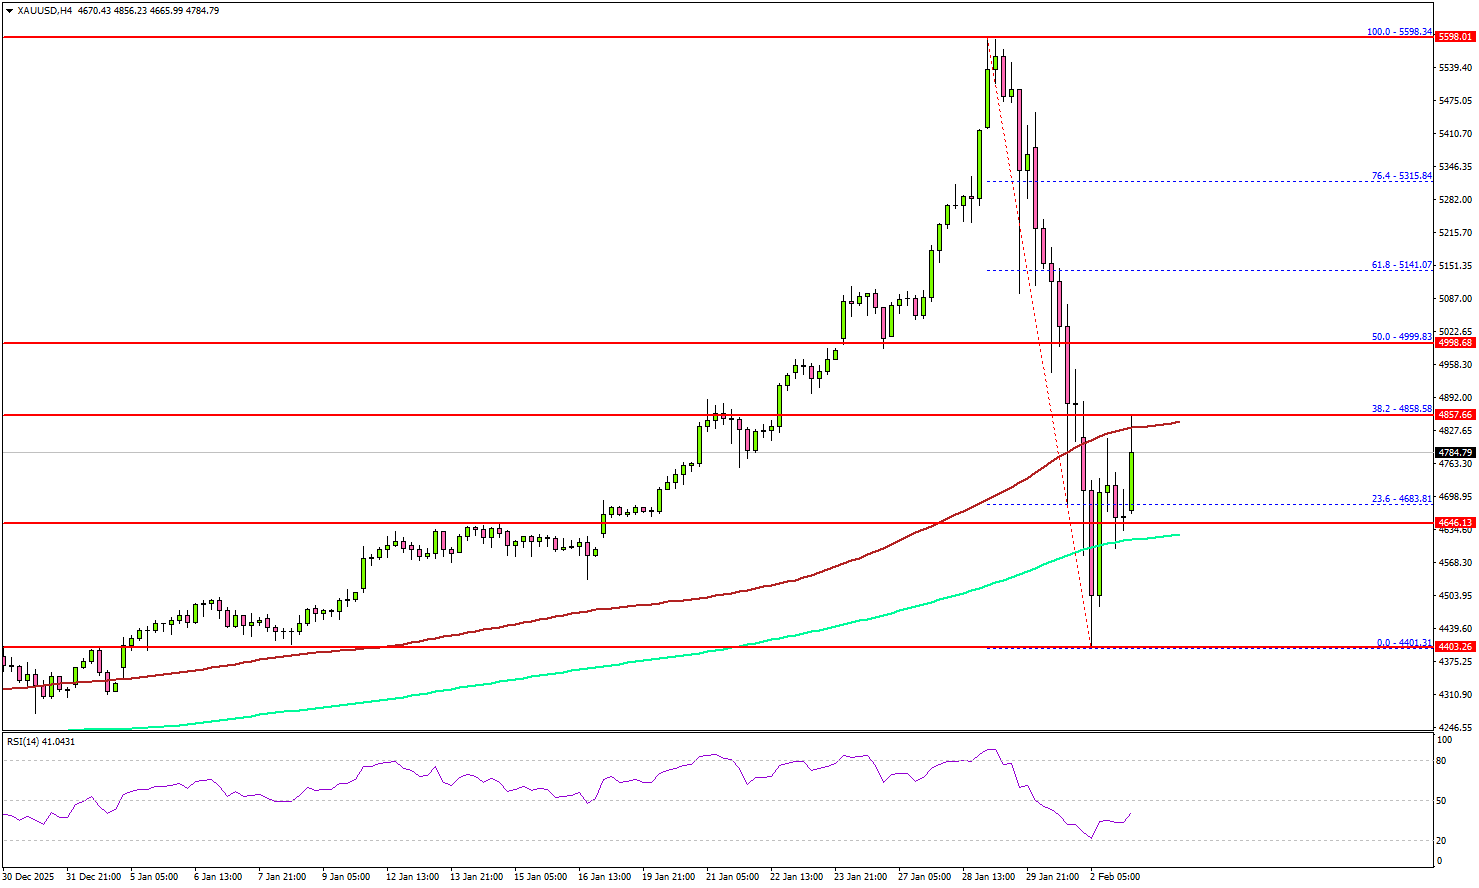
On the upside, immediate resistance is near the $4,850 level and the 100 Simple Moving Average (red, 4 hours). The next major resistance sits near the $5,000 handle since it coincides with the 50% Fib retracement level of the downward move from the $5,598 swing high to the $4,401 low.
A clear move above $5,00 could open the doors for more upside. In the stated case, the bulls could aim for a move toward $5,200. The main target for the bulls could be $5,320.
If there is another decline, Gold might find bids near the $4,620 level. The first major support sits at $4,550, below which the price might slide to $4,500. The main support sits at $4,400. Any more losses might call for a test of at $4,320 or even $4,200 in the coming days.
Looking at WTI Crude Oil, the price recovered above $65.00 before the bears took a stand near $66.50.
Economic Releases to Watch Today
- Fed’s Barkin speech.
- Fed’s Bowman speech.


