
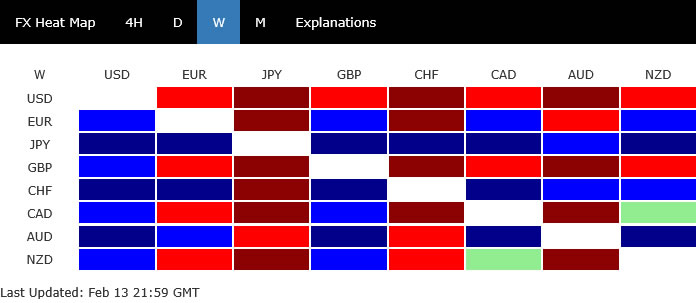
There was no single, dominant theme in currency markets last week. Instead, price action reflected a mix of cross-asset divergences. Dollar ended as the worst performer, despite the fact that Fed expectations barely shifted following high-profile releases of non-farm payrolls and CPI. Meanwhile, US Equities experienced volatility, particularly around renewed AI disruption fears, yet there was no decisive breakout in either direction.
The most consequential development was the sharp dive in US yields. The 10-year yield’s slide appeared disproportionate to changes in Fed pricing, hinting that capital flows and positioning dynamics may be playing a larger role than policy expectations. That yield compression likely weighed on the Dollar, even though the selloff has been restrained rather than disorderly. Dollar Index was under pressure but has not yet entered an accelerated downtrend.
In contrast, Yen emerged as the standout performer. Notably, its rally occurred alongside continued strength in Japanese equities, breaking from the traditional inverse correlation between the currency and risk sentiment. Yet momentum in Yen has already begun to stall near key resistance levels. Also the durability of its decoupling from risk appetite is uncertain.
Elsewhere, Sterling ranked as the second weakest currency, pressured by renewed political instability within the Labour government and soft GDP data. Swiss Franc, by contrast, was the second strongest, reinforcing the impression of underlying caution even if global equities did not fully reflect risk aversion.
Aussie also posted solid gains, supported by hawkish RBA commentary that kept the door open for further tightening. However, momentum there is fading as broader risk appetite softens. Euro, Loonie and Kiwi drifted in the middle, lacking clear directional conviction — like passersby in a market still searching for its next unifying theme.
Data Fails to Inspire; NASDAQ’s Rejection Raises Caution
US equities experienced elevated volatility last week but ultimately failed to establish a decisive direction. Stronger-than-expected non-farm payrolls and a slightly softer CPI print provided headline movement, yet neither report altered the broader narrative in a meaningful way.
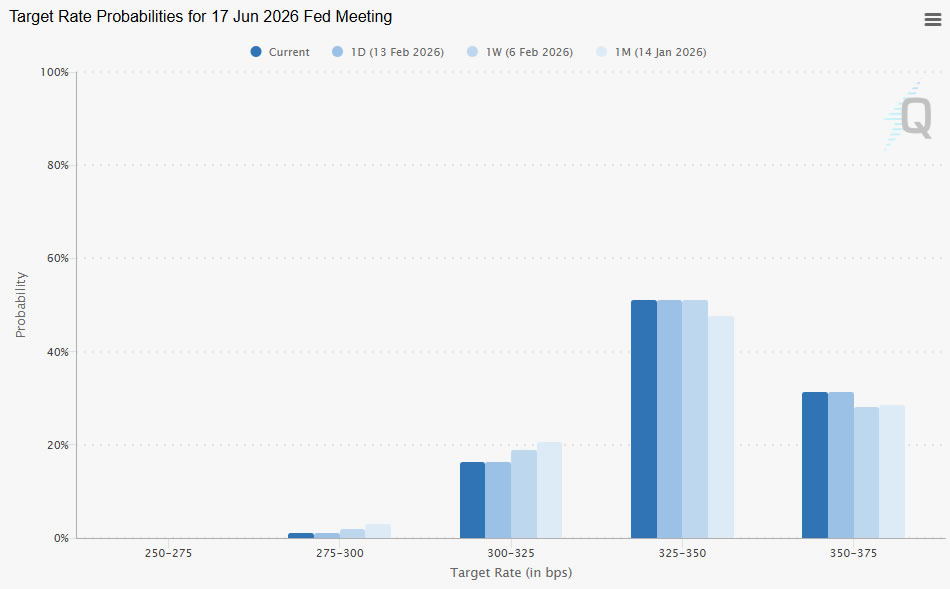
Markets quickly recognized that the data did little to shift Federal Reserve expectations. Pricing for a March hold moved from around 80% to roughly 90%. June cut odds dipped marginally from 72% to 69%. Those are incremental adjustments rather than regime changes.
With policy expectations stable, investor focus drifted back toward structural concerns — particularly renewed fears around AI-driven disruption. Technology and software shares remained sensitive, though selling pressure has so far lacked the intensity of a full risk-off unwind.
Importantly, the broader indexes are still holding within familiar ranges. The S&P 500 and NASDAQ remain contained inside consolidation structures, while DOW even managed to print a fresh record before paring gains.
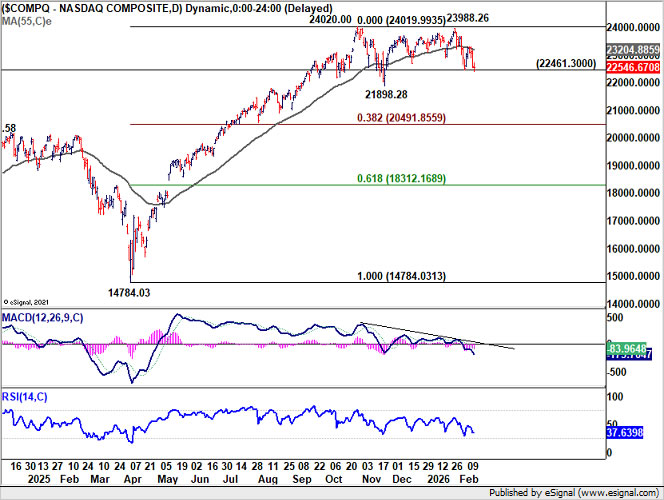
Technically, however, risk is tilting to the downside for NASDAQ. The index was rejected at its 55 D EMA (now at 23,204), a development that often signals near-term vulnerability. NASDAQ should have already entered the third leg of the corrective pattern from 24,020.00 high. Deeper decline toward 21,898 support, and possibly below, is likely in the near term.
But for now, it’s seen as in correction to the up trend from 147,84.03 only, not a larger scale one. Hence, downside should be contained by 38.2% retracement of 14,784.03 to 24,020.00 at 20,491.85 to bring rebound.
10-Year Yield Collapse, Dollar Index Softens
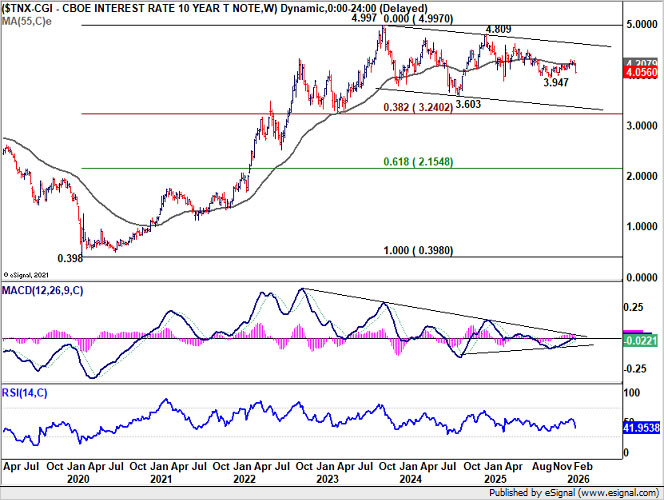
If there was one development that truly defined the week, it was the sharp decline in US Treasury yields. 10-year yield plunged to close near 4.056, a dramatic reversal from its January high at 4.311.
At first glance, some attributed the fall to expectations of faster Fed easing. However, interest rate pricing tells a different story. March remains firmly priced as a hold, while June cut probabilities have only shifted marginally. The yield move appears disproportionate to changes in Fed expectations.
A more plausible explanation lies in shifting asset allocation. With precious metals suffering steep declines in late January — Gold dropping more than 20% and Silver nearly 50% at one point — capital may have rotated back into Treasuries. Bitcoin’s sharp drawdown reinforces the broader de-risking narrative.
Safe-haven demand for US government bonds appears to have quietly re-emerged. The nomination of Kevin Warsh as the next Fed Chair may also have restored some institutional confidence in policy continuity, reducing fears of structural instability.
Technically, the break below 4.108 support in 10-year yield confirmed that the rebound from 3.947 was merely corrective, and topped at 4.311. The move decisively shifted near-term risk back to the downside. As long as 55 D EMA (now at 4.173) caps upside attempts, the path of least resistance remains lower. The next obvious target is a retest of 3.947.
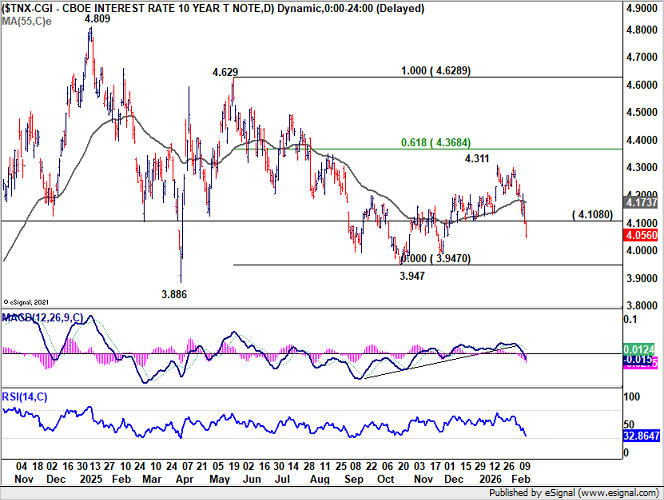
For now, sustained break below 3.947 is not the base case. But if equity markets deepen their correction, that level could give way, potentially resuming the broader downtrend visible on the weekly chart. Indeed, rejection by 55 W EMA (now at 4.207) carries medium term bearish implications.
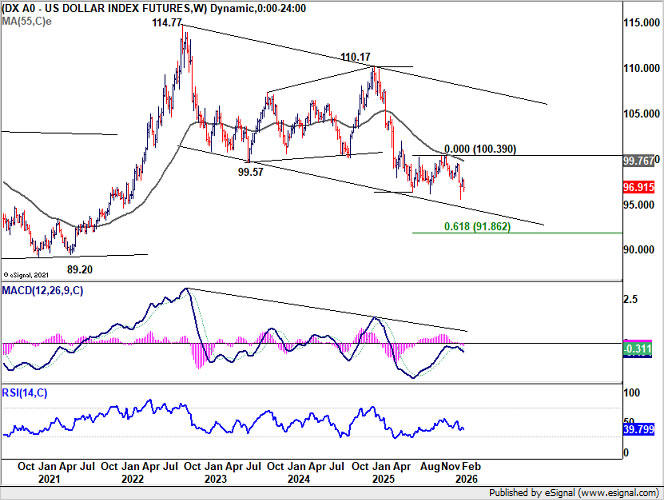
Meanwhile, Dollar Index’s dip last week suggests that recovery from 95.55 has failed 55 D EMA (now at 98.04) on first attempt. There is prospect of a strong rebound in Dollar Index if stock market correction intensify. But upside should be capped below 100.39 resistance.
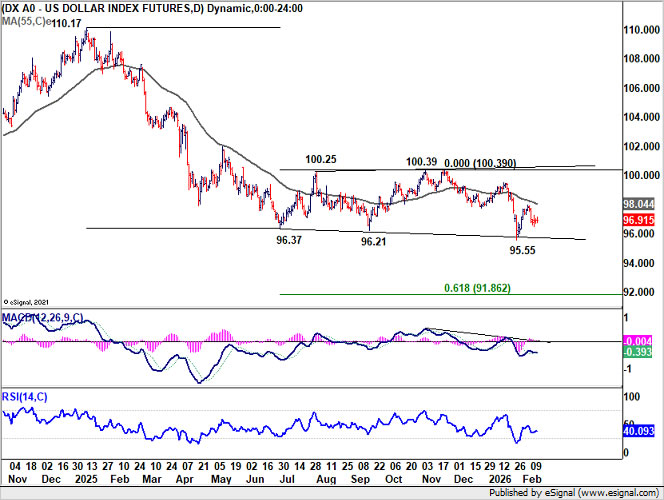
Medium term outlook remains bearish for now. Firm break of 95.55 will resume the down trend from 110.17 (2025 high) to 61.8% projection of 110.17 to 96.37 from 100.39 at 91.86.
Japan Breaks the Mold as Yen Decouples From Equities
Japan delivered the clearest directional story of the week. Nikkei surged to fresh record highs while Yen rallied alongside equities — a rare decoupling from its traditional inverse correlation with risk assets.
The catalyst was political. Prime Minister Sanae Takaichi’s landslide snap election victory provided markets with clarity and a strong mandate. Investors interpreted the LDP supermajority as enabling more coherent fiscal execution without heavy concessions to coalition partners. Equity markets embraced the prospect of targeted stimulus, tax adjustments and structural reform. The rally was not merely momentum-driven; it was narrative-driven. Political certainty replaced fragmentation.
What made the move more unusual was Yen’s strength. Historically, a surging Nikkei tends to coincide with Yen weakness. This time, however, currency markets priced in a different dynamic. Markets appear to believe that a stronger mandate could lead to more disciplined fiscal management rather than unchecked stimulus. That interpretation has lent support to Yen, at least temporarily.
Still, Yen momentum began to stall toward the end of the week as the rally ran into key resistance levels, suggesting election optimism may now be largely priced in. The relations between Yen and stocks could revert back to normal ahead.
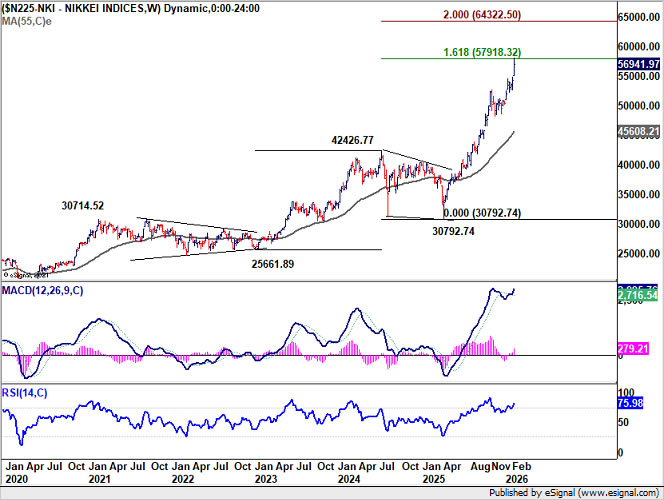
Technically, Nikkei is approaching a critical long-term Fibonacci resistance at 161.8% projection of 25,661.89 to 42,426.77 from 30,792.74 at 57,918.32. Overbought conditions raise the risk of consolidation.
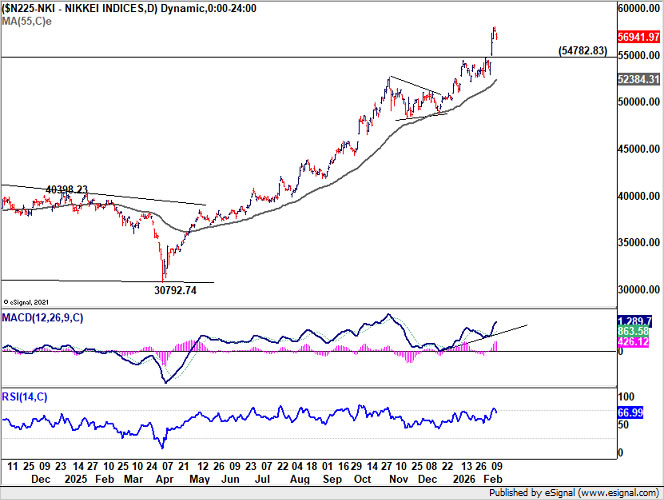
A break below 54,782 would signal that Nikkei has entered a corrective phase with risk of deeper pullback. Such a move could revive Yen strength and push USD/JPY through 150 toward 145.
Conversely, decisive clearance above 57,918 would open the door to 60,000 and potentially 200% projection near 64,322.50. That scenario would likely reintroduce downward pressure on Yen. Sustained Nikkei strength could push the USD/JPY back toward 160.
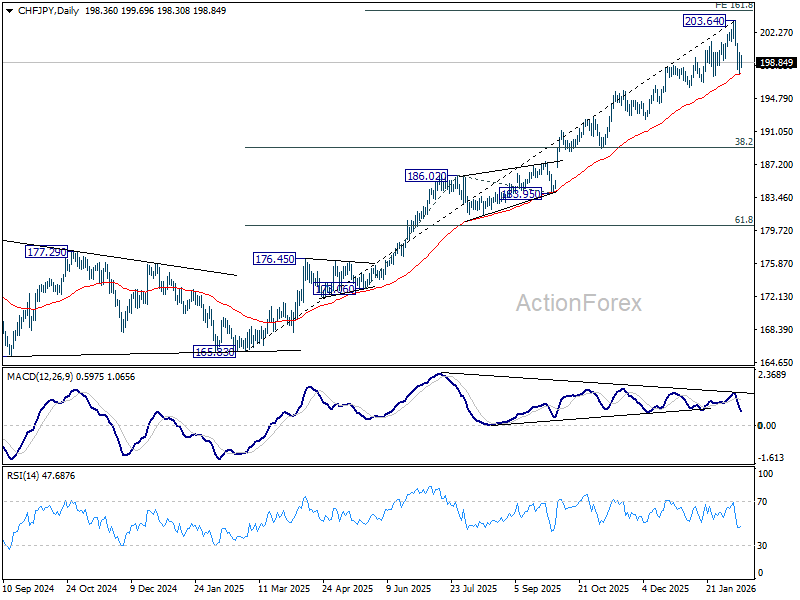
As for Yen’s next move, CHF/JPY is worth some monitoring. Both are safe have currencies and thus the cross is a good candidate to indicate the underlying direction of Yen.
Risk of a deep medium term correction in CHF/JPY is building even though confirmation is still needed. Bearish divergence condition in D MACD suggests that momentum has been persistently diminishing since last June. Also, it’s medium term target of 161.8% projection of 173.06 to 186.02 from 183.95 at 204.92 was nearly met.
Sustained break of 55 D EMA (now at 197.53) will indicate that a medium term top should be formed at 203.64 already. CHF/JPY should then correct the whole five-wave up trend from 165.83 (2025 low), and target 38.2% retracement of 165.83 to 203.64 at 189.19.
AUD/USD Weekly Report
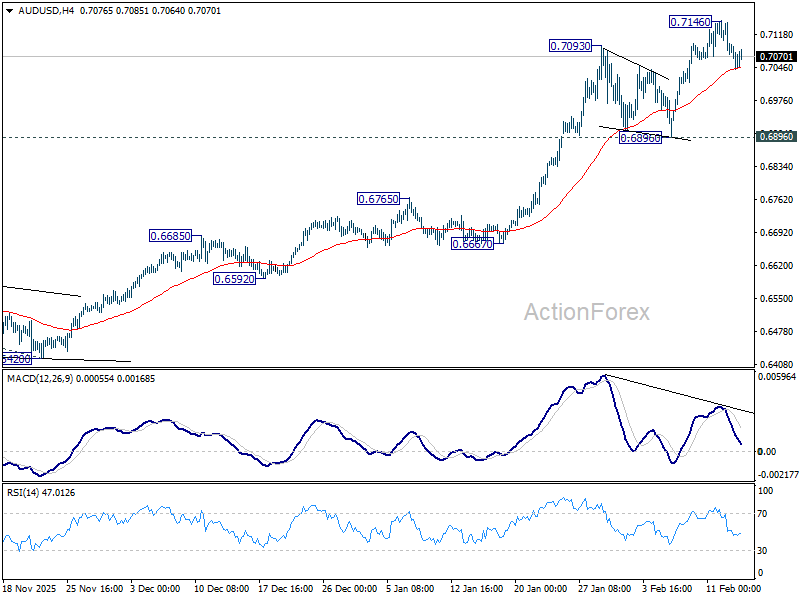
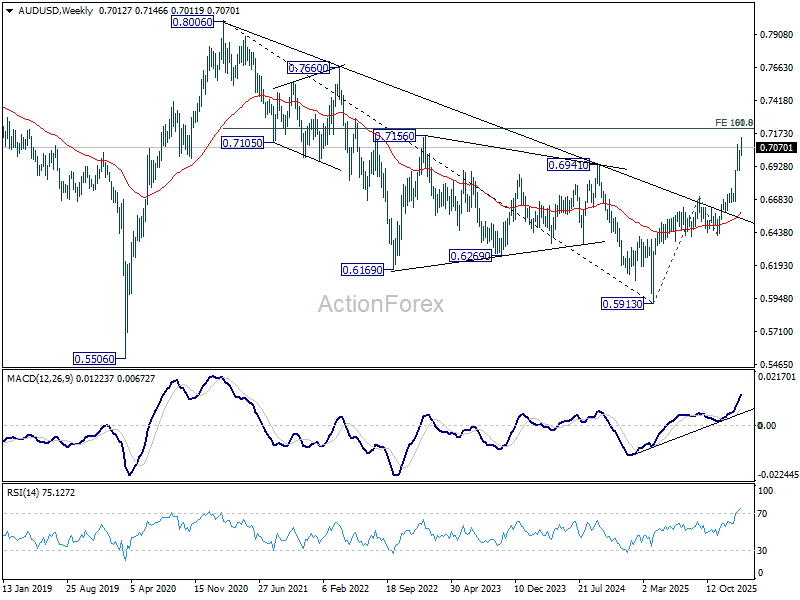
AUD/USD edged higher to 0.7146 last week, but subsequent retreat indicates short term topping, on bearish divergence condition in 4H MACD. Initial bias remains neutral this week for consolidations, and deeper retreat might be seen. But downside should be contained above 0.6896 support to bring another rally. On the upside, above 0.7146 will resume larger up trend to 100% projection of 0.5913 to 0.6706 from 0.6420 at 0.7213.
In the bigger picture, current development argues that rise from 0.5913 (2024 low) is reversing whole down trend from 0.8006 (2021 high). Further rally should be seen to 61.8% retracement of 0.8006 to 0.5913 at 0.7206. This will remain the favored case as long as 0.6706 resistance turned support holds, even in case of deep pullback.
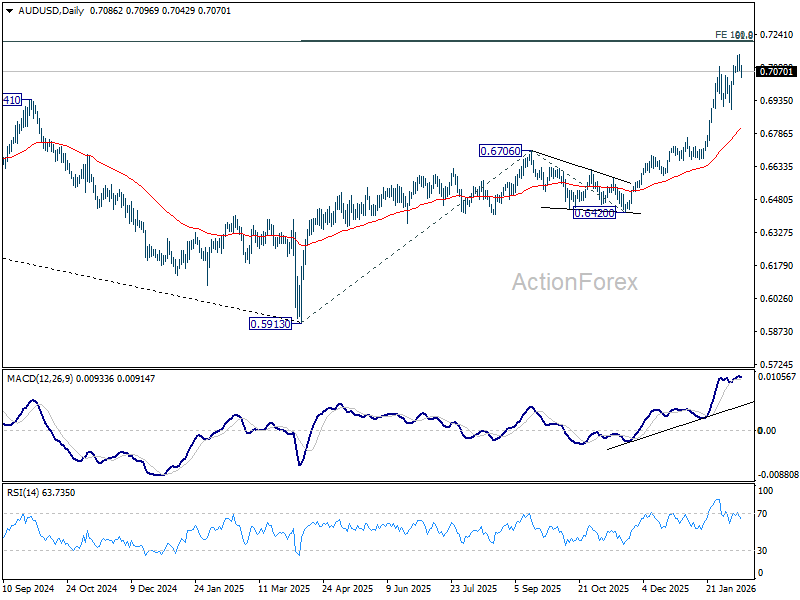
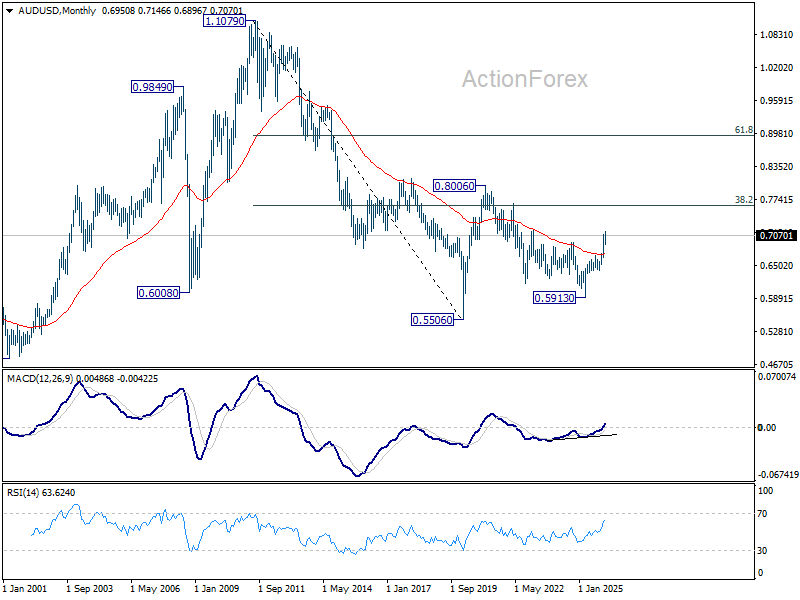
In the long term picture, rise from 0.5913 is seen as the third leg of the whole pattern from 0.5506 (2020 low). It’s still early to judge if this is an impulsive or corrective pattern. But in either case, further rise should be seen back to 0.8006 and possibly above.


