
- Oil just concluded a historic session yesterday, with 30% moves up and down in a crazy rollercoaster.
- WTI is the subject of global fears, as real-economy supply shocks get priced further, but prices are stabilizing.
- Exploring an in-depth Technical Analysis of the commodity.
Yesterday’s historic session in Oil
Once again, Black Gold found itself in the middle of chaotic price action, with yesterday’s session breaking records across all types of volatility.
The Globex open saw an 11% gap (from $92 to $103) that quickly turned into a 30% squeeze towards $120 – That lasted from 18:00 on Sunday to 22:00.
Shortly after, G7 Leaders united to prepare for the potential release of Strategic Reserves, which aimed to calm Markets significantly and worked well, bringing commodity prices back to their weekly opening levels.
Shortly after, G7 Leaders united to prepare for the potential release of Strategic Reserves, which aimed to calm Markets significantly and worked well, bringing commodity prices back to their weekly opening levels. The Reserves will not be released just yet, but the comments helped soothe the overall panic.
President Trump added more fuel to the volatility fire by saying during a private ABC interview that the war could be resolved “very soon”.
The issue with this comment is that it was quickly taken out of context and led to a $12 drop in WTI prices, but erased some of this progress overnight.
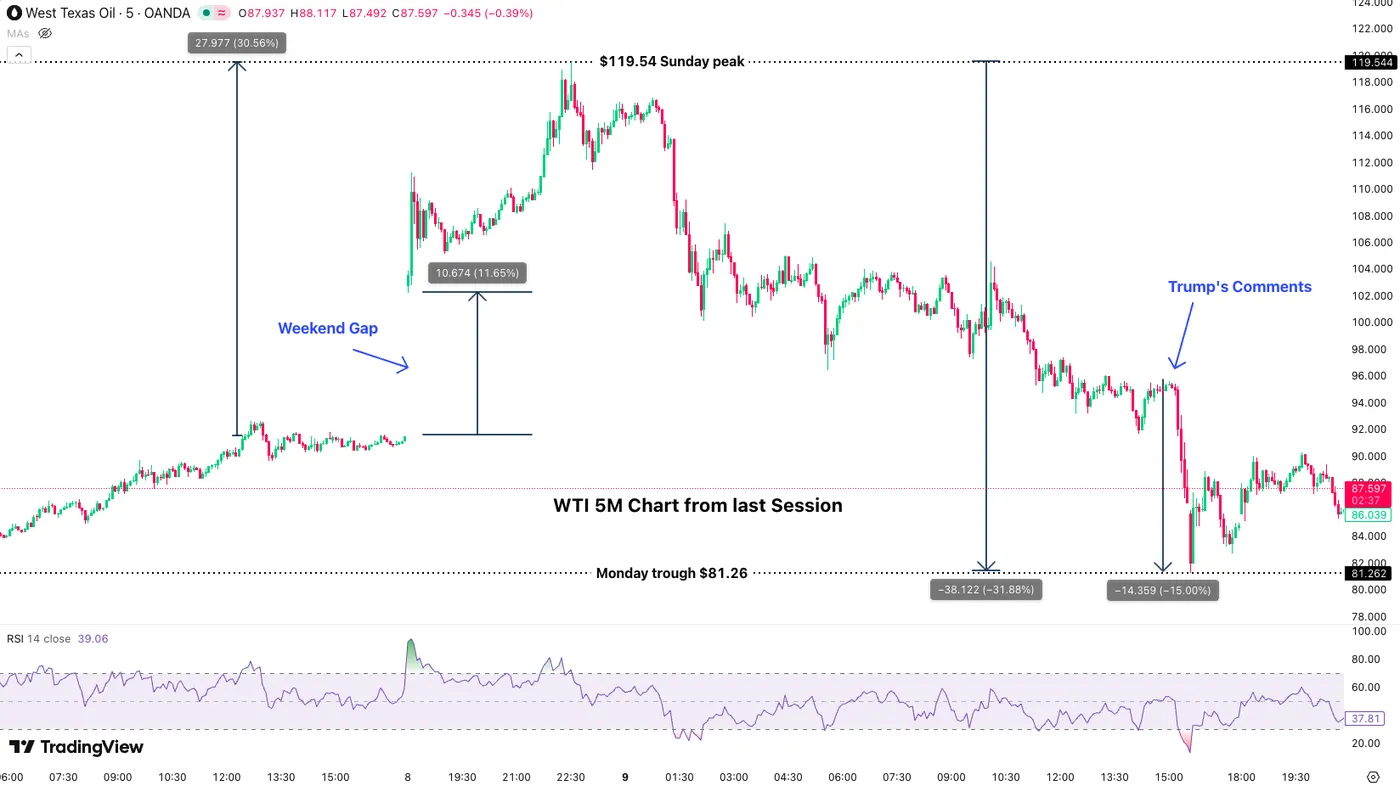
WTI Oil 5M Chart from March 9, 2026. Source: TradingView
So what’s the update?
Unfortunately, despite Trump’s optimistic comments in yesterday’s late afternoon, the War won’t conclude so easily.
The President’s advisors have urged him to prepare a concrete exit plan – while military progress has been advancing well, there are still clouds over the proper way to achieve lasting peace or even the desired regime change.
The anxiety will remain if no clear plan is made, with attacks on civilian infrastructures all over the Middle East continuing. After 11 days of conflict, it may be too early to assume the counterattacks will continue indefinitely, but some clarity would be very welcome.
The Strait of Hormuz remains in de facto closure, with some thin traffic through, but this pales in comparison to usual flows as drone and ballistic missile threats remain elevated.
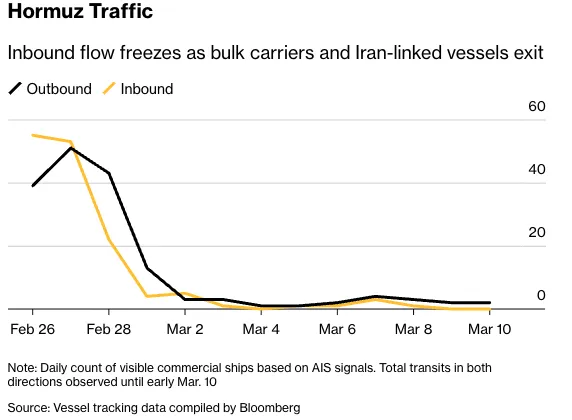
Strait of Hormuz Sea Traffic since February 27 – Source: Bloomberg
To respond to the large drops in maritime shipments, Saudi Aramco signalled that they were ramping up Oil flows in the East-West pipeline to full capacity and they are slowly getting there.
However, this would only add to 7M barrels/day which doesn’t come close to the usual 20M bbl/day going through Hormuz in normal activity – The world’s largest energy-commodity production firm mentioned some 180M barrels of Oil getting affected by the ongoing conflict.
Furthermore, the IRGC makes sure to not only strike civilian infrastructures but also Oil and Natural Gas production facilities.
With volatility now largely slowing down, let’s explore a few key charts and scenarios for WTI (US) Oil to prepare for potential breakout levels.
US Oil Intraday Time-frame Analysis
WTI 4H Chart
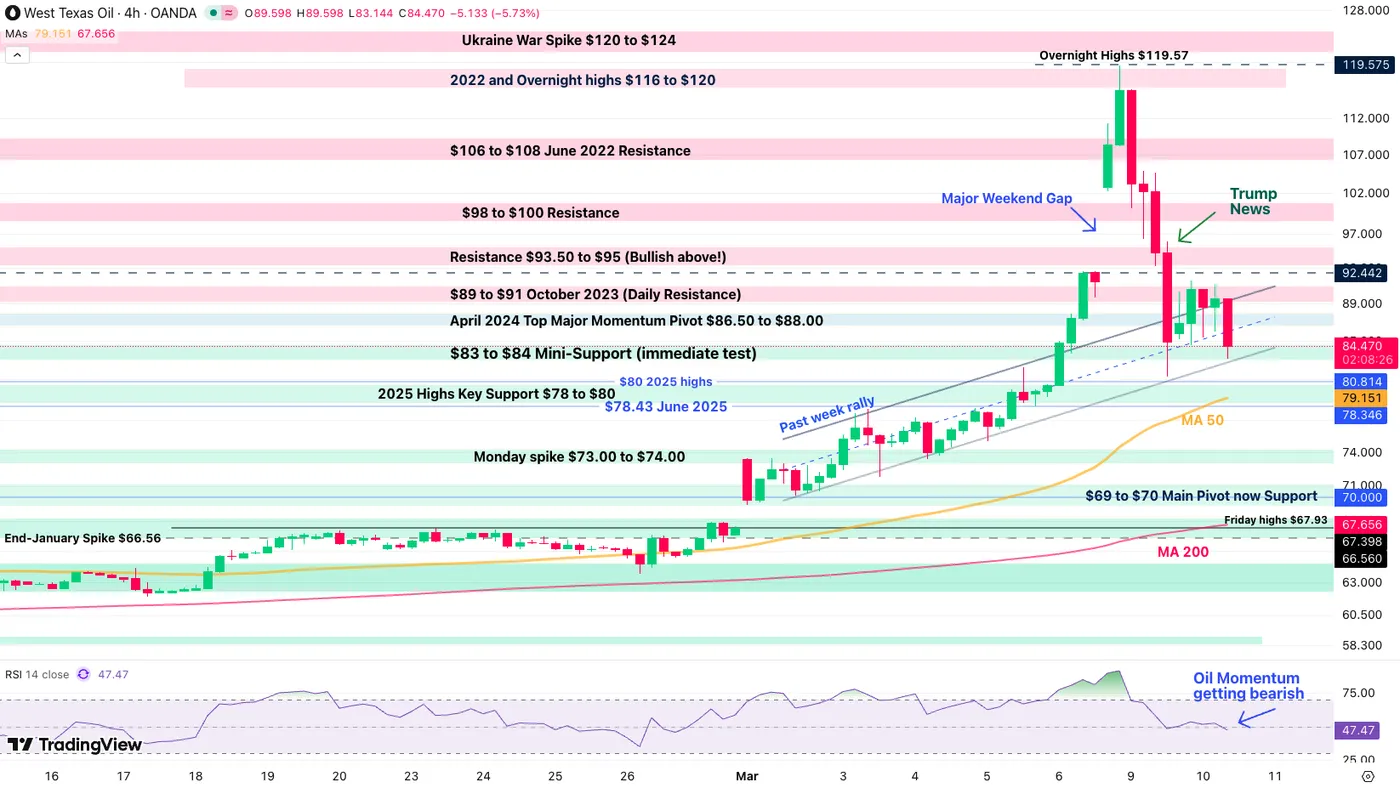
WTI Oil 4H Chart – March 10, 2026. Source: TradingView
Oil is now returning within its past week’s upward channel, having largely cut off its squeeze-momentum.
This implies that the largest volatility spikes are now behind us.
Even with the 4H timeframe RSI falling, there is still a decent probability that Oil will grind higher towards $100, particularly if the conflict drags on further – For now, momentum remains more neutral than anything.
Let’s look at further details.
WTI 2H Chart and Technical Levels
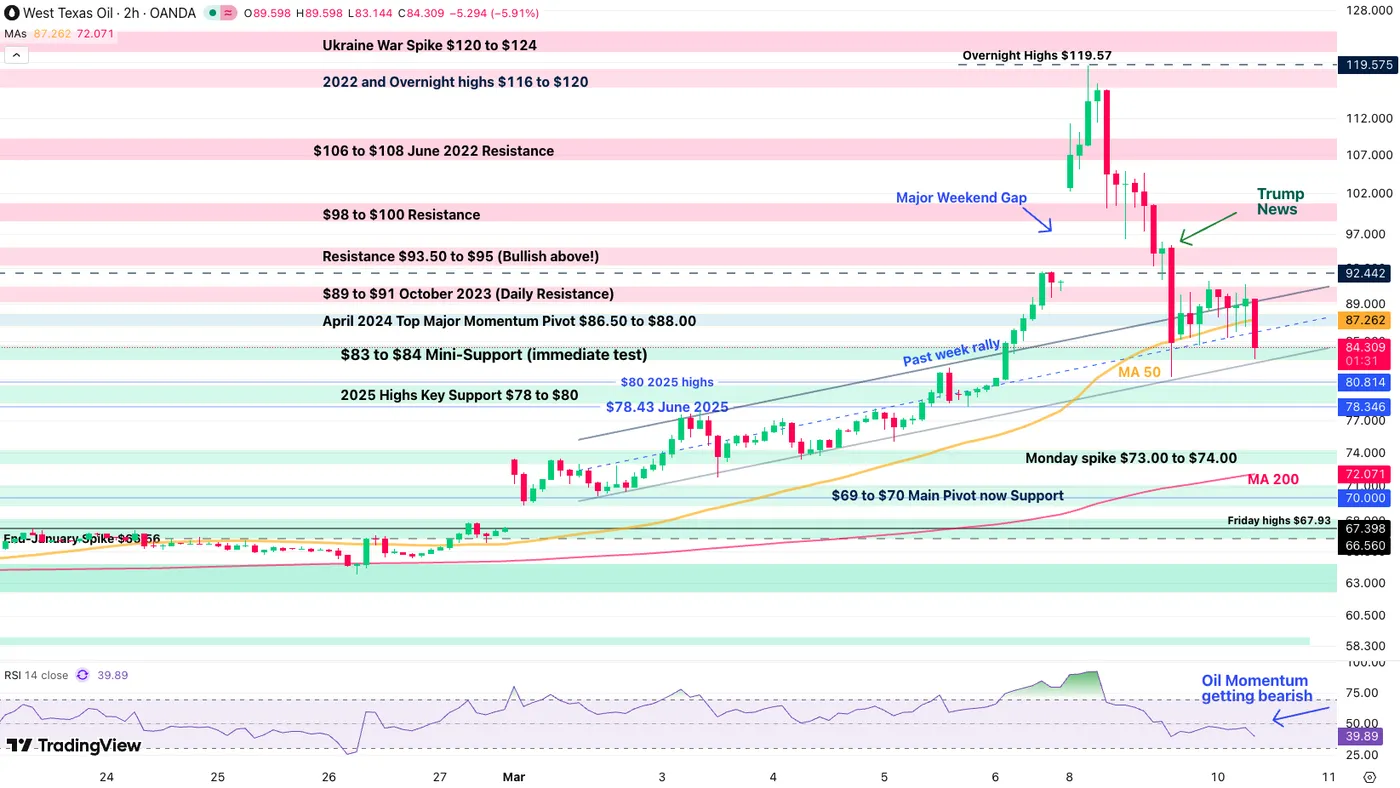
WTI Oil 2H Chart – March 10, 2026. Source: TradingView
Due to its recent volatility, WTI has established many Support and Resistance levels and they require flexibility as they have been changing by the minute. The key levels are bolded.
To check out different trading scenarios, I invite you to check out the 30M chart just below.
WTI Technical Levels:
Resistance Levels
- $89 to $91 Channel and potential range highs
- April 2024 Top Major Momentum Pivot $86.50 to $88.00
- Resistance $93.50 to $95 (Bullish above!)
- $98 to $100 Resistance
- $106 to $108 June 2022 Resistance
- 2022 and Monday highs $116 to $120
Support Levels
- $82.80 to $84 Daily Support and channel lows (immediate test)
- 2025 Highs Key Support $78 to $80
- Past week spike $73.00 to $74.00
- $69 to $70 Main Support
- September 2025 Mid-term Support $67.50 to $68
- 2025 lows $55.00
WTI 30M Chart
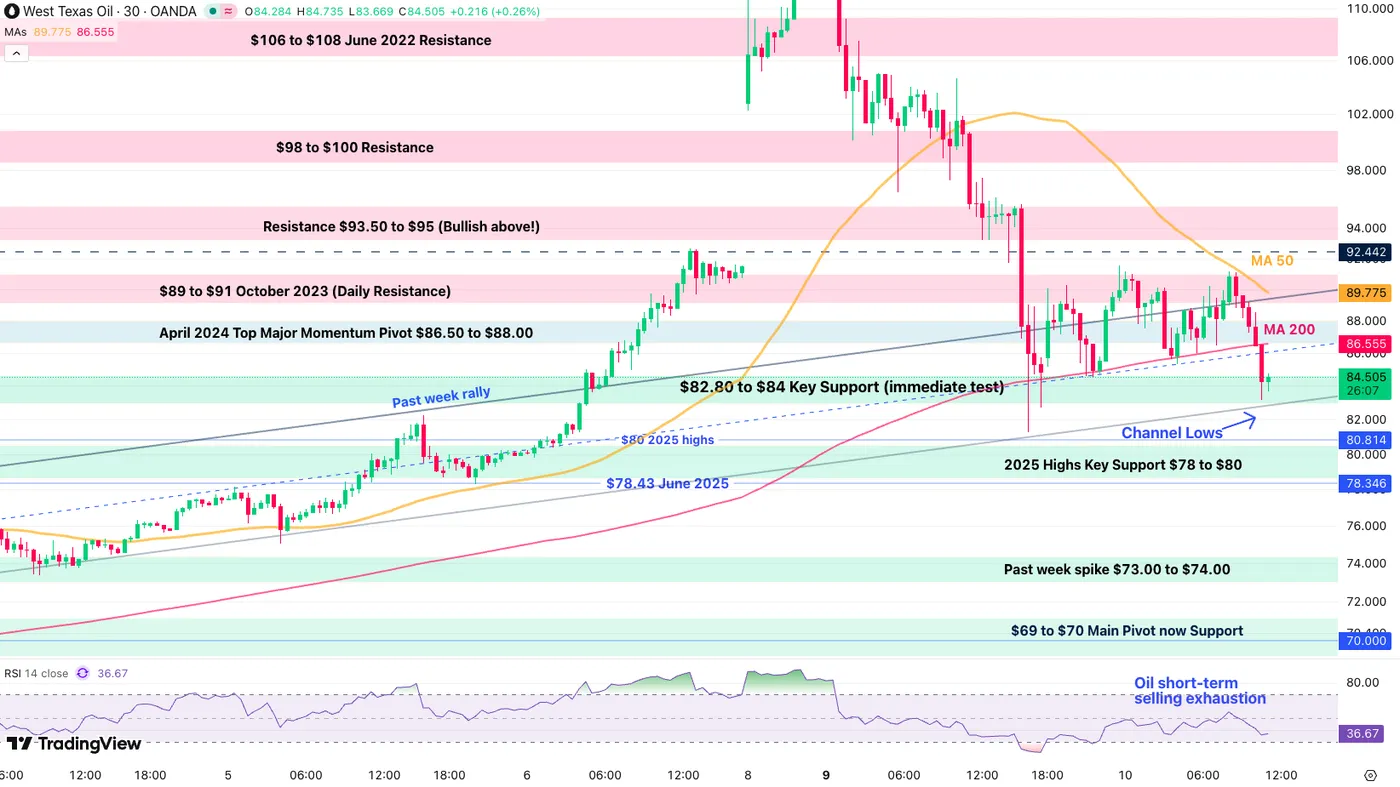
WTI Oil 30M Chart – March 10, 2026. Source: TradingView
Oil is now well within its ascending channel, hence this provides essential trading levels to keep in check:
- Coming at the lows of the channel, selling exhaustion could point to a short-term rebound towards $90 – look at the 30M 50-period MA.
- A range between $82 to $90 could well be taking place, so look at whether the move remains contained.
- Breaking the daily support ($82.80) and Channel would point to a test of the $76 Support
Any break above $90 with high momentum and volume would imply a test of $95; $100 could then get reached fast depending on the news.
Safe Trades, a restful weekend, and keep track of the advancement of the conflict!


