
- A two-week US-Iran ceasefire was reached, immediately unwinding the “fear trade” that had been building in global markets.
- Oil prices tumbled dramatically, with US Crude (WTI) falling approximately 15%, easing concerns about “War Inflation”.
- The ceasefire is viewed as only a tactical pause; traders are cautioned to remain vigilant as geopolitical headlines could quickly turn sentiment.
After weeks of trading on the edge of a precipice, global markets have finally caught a break. In what can only be described as a classic “Trumpian” 11th-hour maneuver, a two-week ceasefire between the US and Iran has been reached, just hours before a deadline that threatened to set the Middle East and global energy markets ablaze.
The relief across trading floors this Wednesday morning is palpable. For weeks, we’ve watched the Strait of Hormuz effectively become a no-go zone, choking off 20% of the world’s energy supply and sending volatility into overdrive. But with the announcement of Iran’s “workable 10-point plan,” the “fear trade” is unwinding as quickly as it built up.
Market Reaction: Crude Crumbles, Risk-On Returns
The most dramatic moves, unsurprisingly, are in the energy pits. Oil prices, which had been flirting with disastrous levels, have seen a massive flush-out. U.S. Crude (WTI) futures tumbled roughly 15%, sliding back under the psychological $100 handle to trade around $96.30. Brent Crude followed suit, dropping 13% to the $94.70 mark.
From a technical perspective, this is a massive relief valve for global inflationary pressures. We’ve been discussing the “War Inflation” theme for weeks; this de-escalation provides a much-needed cooling period.
Equities and FX are also seeing a “relief rally”:
- Asia-Pacific: The Nikkei jumped 5%, while South Korea’s KOSPI surged 6%, even triggering a brief volatility halt.
- S&P 500 & Europe: Futures are pointing to a gap up, with European STOXX 50 futures leaping over 5%.
- The Dollar Index (DXY): The “safe-haven of choice” during the tumult has been knocked back to 98.83, a one-month low.
Gold (XAU/USD): Interestingly, Gold remains resilient, climbing 2.5% to $4,820. This suggests that while the immediate “shooting war” fears are fading, investors aren’t ready to completely abandon hedges just yet and the hopes that inflationary pressure may prove short-lived remains in place for now..
The Outlook: A Two-Week Window of Opportunity
The “Iran 10-point plan” is being viewed as a workable framework for longer-term stability, but we must remain cautious. This is a two-week ceasefire, a tactical pause rather than a permanent peace.
Iran’s 10-point plan includes the following terms:
- Commitment to non-aggression
- Iran’s control over the Strait of Hormuz
- Acceptance of Iran’s uranium enrichment
- Lifting of all primary sanctions
- Lifting of all secondary sanctions
- Termination of all UN Security Council resolutions
- Termination of all Board of Governors resolutions
- Paying compensation to Iran
- Withdrawal of US combat forces from the region
- Cessation of war on all fronts, including in Lebanon
Trump says this plan is “a workable basis.”
Part of the ceasefire plan allows Iran and Oman to charge fees on ships transiting through the Strait of Hormuz, per CNN.
A regional official said this money would be used for the reconstruction of Iran.
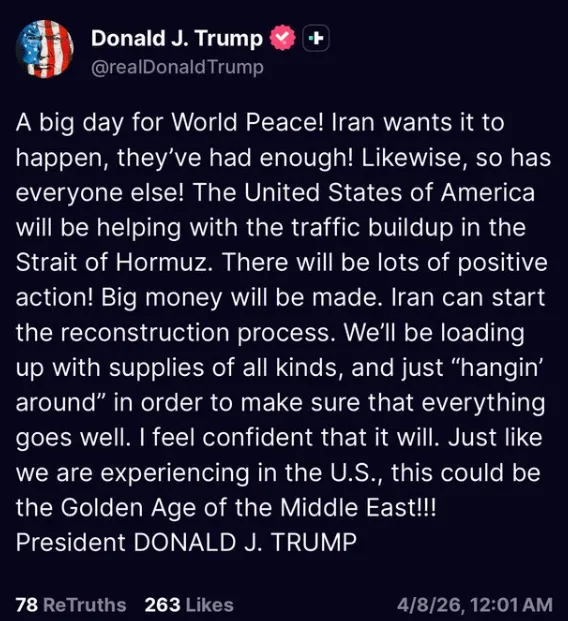
Source: TruthSocial, X
For the day ahead, keep an eye on:
- Supply Chain Normalization: Markets will be looking for physical confirmation that tankers are moving through the Strait of Hormuz without incident.
- Dollar Weakness: If the DXY continues to slide, it could provide further tailwinds for the AUD and EUR, which have already seen significant bounces this morning.
Chart of the day – WTI Oil
The H4 chart for WTI illustrates a “liquidation candle,” with price plummeting nearly 15% following the US-Iran ceasefire. The vertical drop saw oil slice through the 100-period SMA (purple) and psychological support at $100.00 with ease, signaling a massive shift in sentiment.
Currently, WTI is searching for a floor near the $96.30 mark. The RSI (14) has dipped sharply to 33.5, hovering just above oversold territory, which suggests the initial panic selling may be slowing. However, with price now trading well below the 100 SMA, the immediate bias remains bearish.
Key Levels to Watch:
- Support: If the slide continues, the 200-period SMA (yellow) near $88.00 and the horizontal support at $90.00 are the next major targets.
- Resistance: Any relief bounce faces a stiff hurdle at the $98.97 (100 SMA) and the previous breakdown point at $100.00.
WTI US Oil Four-Hour Chart, April 8, 2026
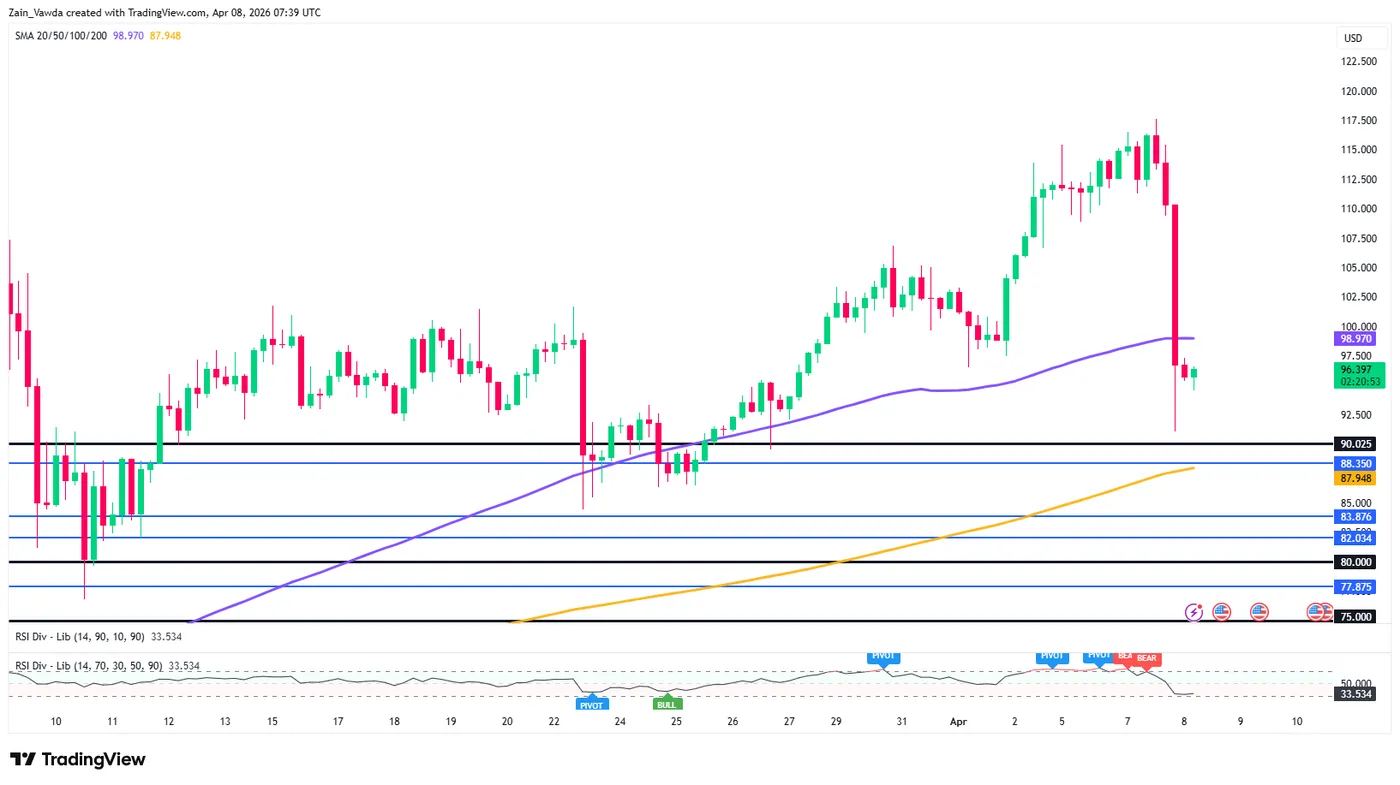
Source: TradingView
To conclude, markets have moved from the “brink” to the “bench.” The ceasefire buys time, and for now, sentiment is king. Traders should enjoy the relief rally but keep their protective stops tight, geopolitical headlines can still turn the tide in minutes


