
Markets stayed composed in early trading, with oil holding below crisis levels despite renewed tensions around the Strait of Hormuz. Brent crude climbed toward $105 after US-Iran talks in Islamabad ended without a breakthrough, yet the absence of panic buying signals that traders are not pricing a full supply shock. Dollar edged higher on the headlines, but gains lacked conviction, reflecting a market that is unwinding the “peace premium” and resetting to cautious positioning rather than turning decisively risk-off.
The muted reaction across assets reinforces the idea that markets are shifting into a “vigilance mode” rather than panic. Asian equities traded lower, but losses were contained. Gold eased slightly on Dollar strength yet held firmly around the $4,700 level. The broader picture suggests that while geopolitical risk has re-entered pricing, it has not triggered disorderly repositioning.
The geopolitical backdrop remains fluid. The US-Iran talks, which stretched over 21 hours, ended without tangible process towards a formal agreement. The primary sticking point was Iran’s refusal to provide an affirmative commitment to abandon its nuclear program, while US demands on regional security remained unchanged. Iran’s counter-demands—including the unfreezing of assets, war reparations, and continued control over the Strait of Hormuz—were also rejected. The failure to bridge these gaps underscores the structural difficulty of reaching a comprehensive deal, even as both sides acknowledged the historic nature of the engagement.
Following the talks, US President Donald Trump announced that the US Navy would begin a blockade of ships entering or leaving the Strait of Hormuz. However, subsequent clarifications from the US Navy and CENTCOM indicate that enforcement is targeted at vessels linked to Iranian ports. This distinction is crucial. Rather than a blanket shutdown, the blockade functions as a surgical economic measure aimed at curbing Iran’s exports.
Restraint also comes from the timeline. The ceasefire remains in place until April 22, leaving a window for renewed negotiations or policy adjustments. Additionally, markets are still factoring in the possibility that deadlines could be extended once again by Trump, further delaying any definitive escalation.
Looking ahead, macro data will begin to intersect with geopolitical developments. US PPI will serve as the first hard signal of how energy costs are feeding into inflation, while the Fed’s Beige Book may offer early insights into economic conditions under rising uncertainty. In Europe, ECB’s policy accounts could reveal how close policymakers are to a rate hike as rising energy prices push them into a more hawkish stance. UK February GDP data will provide a snapshot of growth momentum ahead of the war. In the Asia-Pacific, another strong Australian jobs report would reinforce expectations of further RBA tightening in May.
In currency markets, Dollar is currently the strongest for the day so far, followed by Loonie and Kiwi. Sterling is the weakest, with Swiss Franc and Aussie also underperforming. Euro and Yen are holding in the middle of the pack.
In Asia, at the time of writing, Nikkei is down -0.82%. Hong Kong HSI is down -1.11%. China Shanghai SSE is up 0.11%. Singapore Strait Times is down -0.39%. Japan 10-year JGB yield is up 0.027 at 2.469.
Oil Hits $105 but No Panic as Reality of Hormuz Blockade Falls Short of Headlines
Oil climbs to $105 after US announces a Hormuz blockade, but markets are not pricing a full-blown supply crisis. Instead, traders are unwinding the “peace premium” and resetting to pre-ceasefire risk levels, as the reality of a “targeted” disruption falls short of headline fears. With supply still flowing and diplomacy not fully collapsed, oil remains in a state of “tense vigilance.” Read more.
New Zealand PSI Drops to 46.0, BNZ Sees Economy Nearing Contraction
New Zealand’s services sector weakened further in March, with PSI falling to 46.0 and all key components remaining in contraction. BNZ now warns the economy could be nearing contraction, prompting a downgrade to its 2026 growth outlook. Read more.
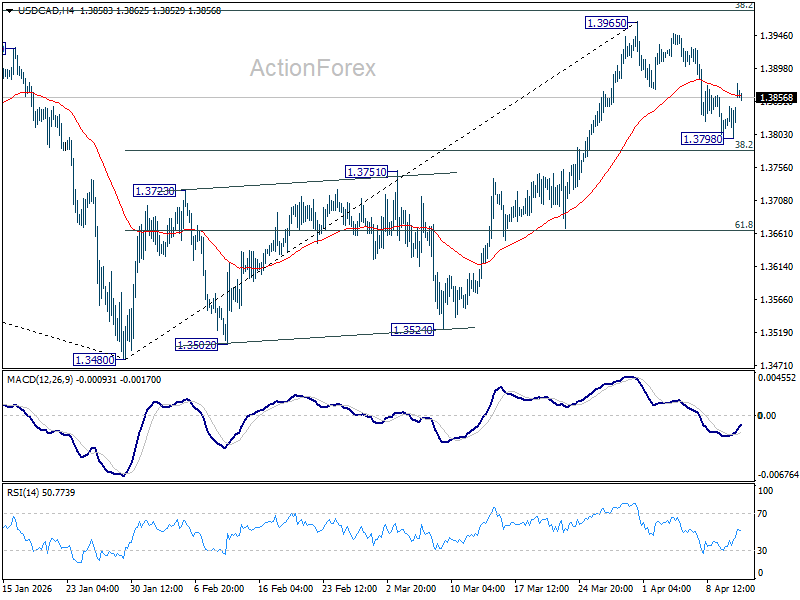
USD/CAD Daily Outlook
Daily Pivots: (S1) 1.3813; (P) 1.3830; (R1) 1.3860; More…
USD/CAD recovered notably today but stays well below 1.3965 resistance. Intraday bias remains neutral first. Consolidations could extend and another dip might be seen. But outlook will stay bullish as long as 38.2% retracement of 1.3840 to 1.3965 at 1.3780 holds. On the upside, firm break of 1.3965 will resume the rise from 1.3480. However, sustained break of 1.3780 will argue that the rebound from 1.3840 has completed, and bring deeper decline to 61.8% retracement at 1.3665 and below.
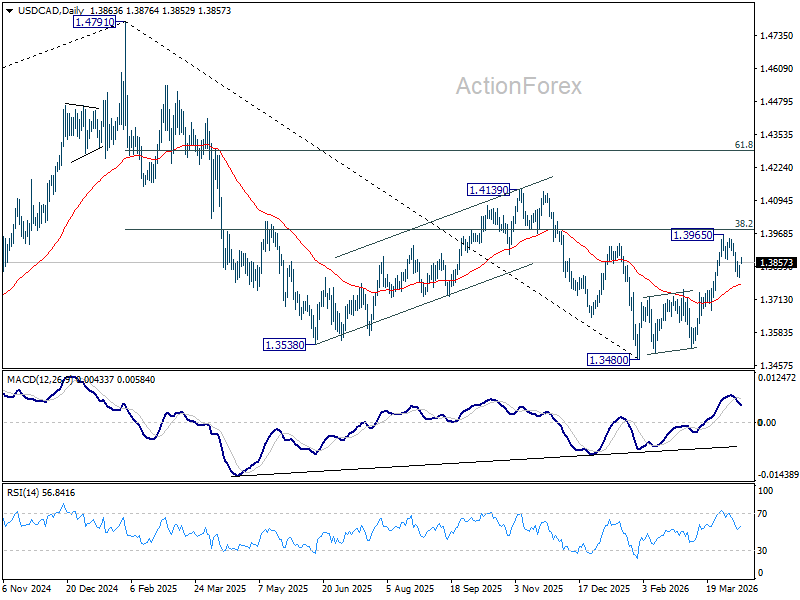
In the bigger picture, price actions from 1.4791 are seen as a corrective pattern to the whole up trend from 1.2005 (2021 low). Deeper fall could be seen, as the pattern extends, to 61.8% retracement of 1.2005 to 1.4791 at 1.3069. However, decisive break of 38.2% retracement of 1.4791 to 1.3480 at 1.3981 will argue that the correction has completed with three waves down to 1.3480 already. Further break of 1.4139 will confirm and bring retest of 1.4791 high.


