
- USD/CAD extends almost two-week losing streak, drops below 50‑day SMA.
- Elevated oil prices underpin the loonie, weighing on the pair.
- RSI and stochastics slip into negative territory.
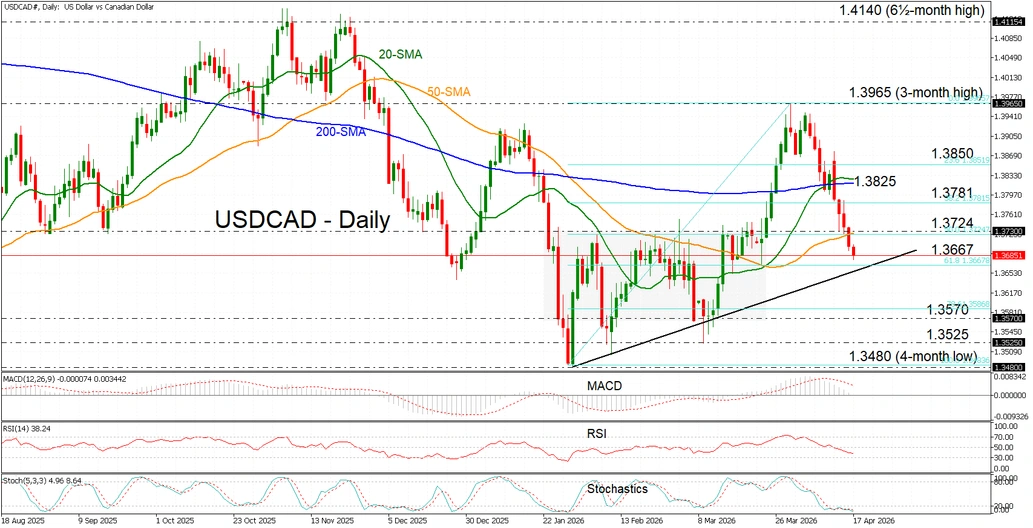
USD/CAD is extending its corrective decline from the year‑to‑date high of 1.3965 reached in late March, sliding for a fifth consecutive session and marking nine down days in the past ten. The move has dragged spot prices to more than three‑week lows near 1.3680, last seen on March 23. Elevated oil prices continue to support the commodity‑linked Canadian dollar, keeping pressure on the pair, although a modest USD recovery could help limit further downside amid ongoing US‑Iran talks.
The pair maintains a bearish near‑term bias after slipping below the 50‑day simple moving average (SMA) closely aligned with the 50% Fibonacci retracement of the January-March upswing at 1.3724. Momentum indicators point to weakening but stabilising downside pressure, with the RSI falling below its neutral threshold, the stochastics dipping into oversold territory, and the MACD remaining marginally positive. This suggests downside momentum is easing rather than reversing decisively.
On the downside, initial support is seen at the 61.8% Fibonacci retracement near 1.3667. Below that, a break beneath the short‑term rising trendline could expose 1.3570 – the range floor of a recent consolidation – and further below the March 9 swing low at 1.3525, where sellers may become more cautious.
On the upside, initial resistance lies at the 50‑day SMA near 1.3724, followed by the 38.2% Fibonacci retracement at 1.3781. A sustained break above this zone could open the way toward a confluence area near 1.3825, where the 20‑ and 200‑day SMAs align, ahead of the 23.6% Fibonacci level at 1.3850.
Overall, USDCAD is extending a sharp pullback from three‑month highs to three‑week lows, having slipped below all three key plotted SMAs. However, if the rising trendline manages to halt the decline, potential for a near‑term rebound may emerge.


