
Key takeaways
- Bullish trend intact despite volatility: The Nasdaq 100 has led the post-ceasefire rally, breaking to new highs, and remains in a bullish structure even after a gap-down driven by renewed US–Iran tensions.
- Strong market breadth supports upside: A sharp improvement in breadth, more stocks trading above key moving averages, confirms broad participation and reinforces the sustainability of the uptrend.
- Key support holding keeps bulls in control: The index is stabilising above the critical 26,288/26,142 support zone; holding this level maintains upside potential toward 26,700–27,380, while a break below risks a deeper corrective pullback.
Risk assets, particularly global equities, staged a sharp bullish reversal on 8 February 2026 following the US–Iran temporary ceasefire, which paused the six-week conflict and raised hopes of a broader peace deal. The high-beta, tech-heavy Nasdaq 100 led the rally, reversing an earlier 8% loss to post a 6.9% gain (from the 27 February 2026 pre-war baseline to 17 April 2026) and breaking above its previous all-time high set on 29 October 2025 (see Fig. 1).
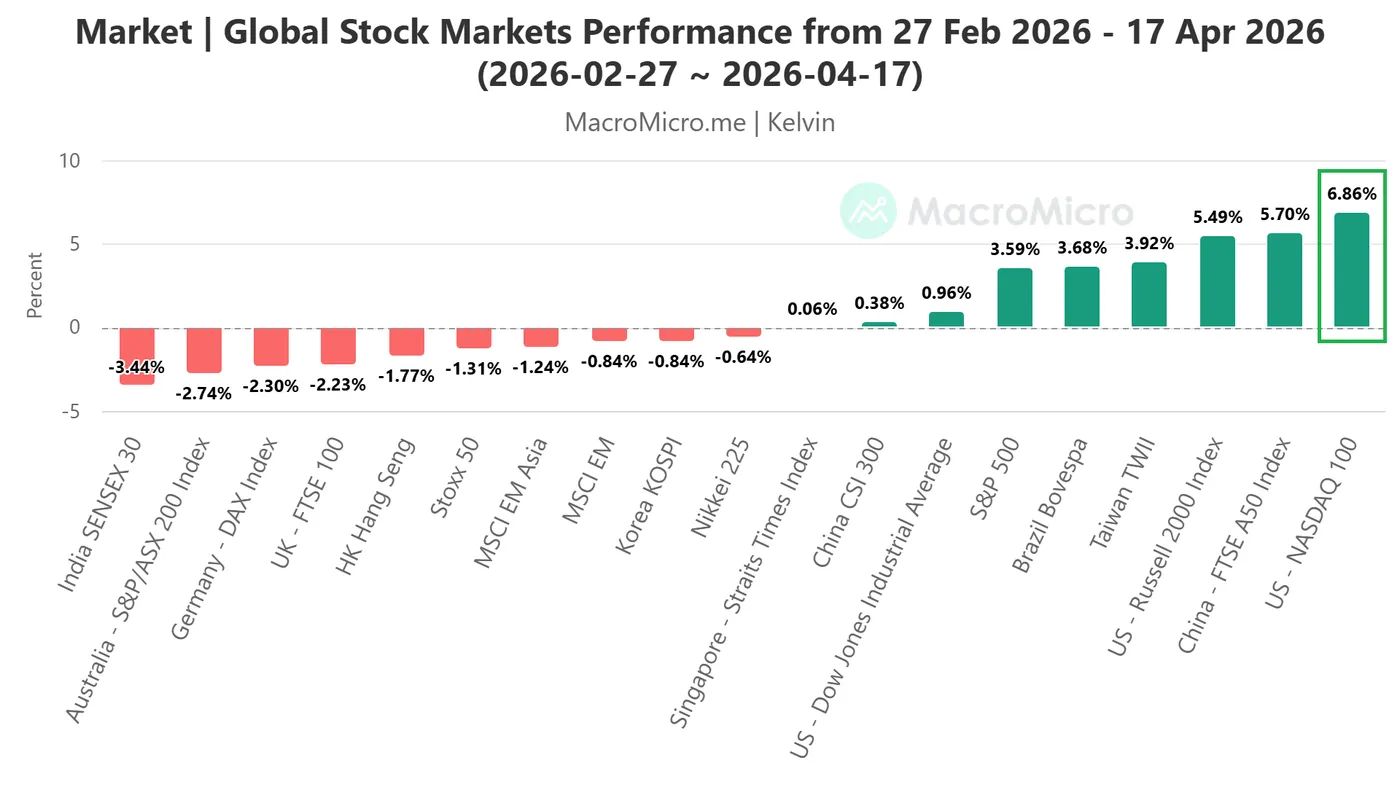
Fig. 1: Global benchmark stock indices performances from 27 Feb 2026 to 17 Apr 2026 (Source: MacroMicro).
Nasdaq 100’s market breadth has improved significantly
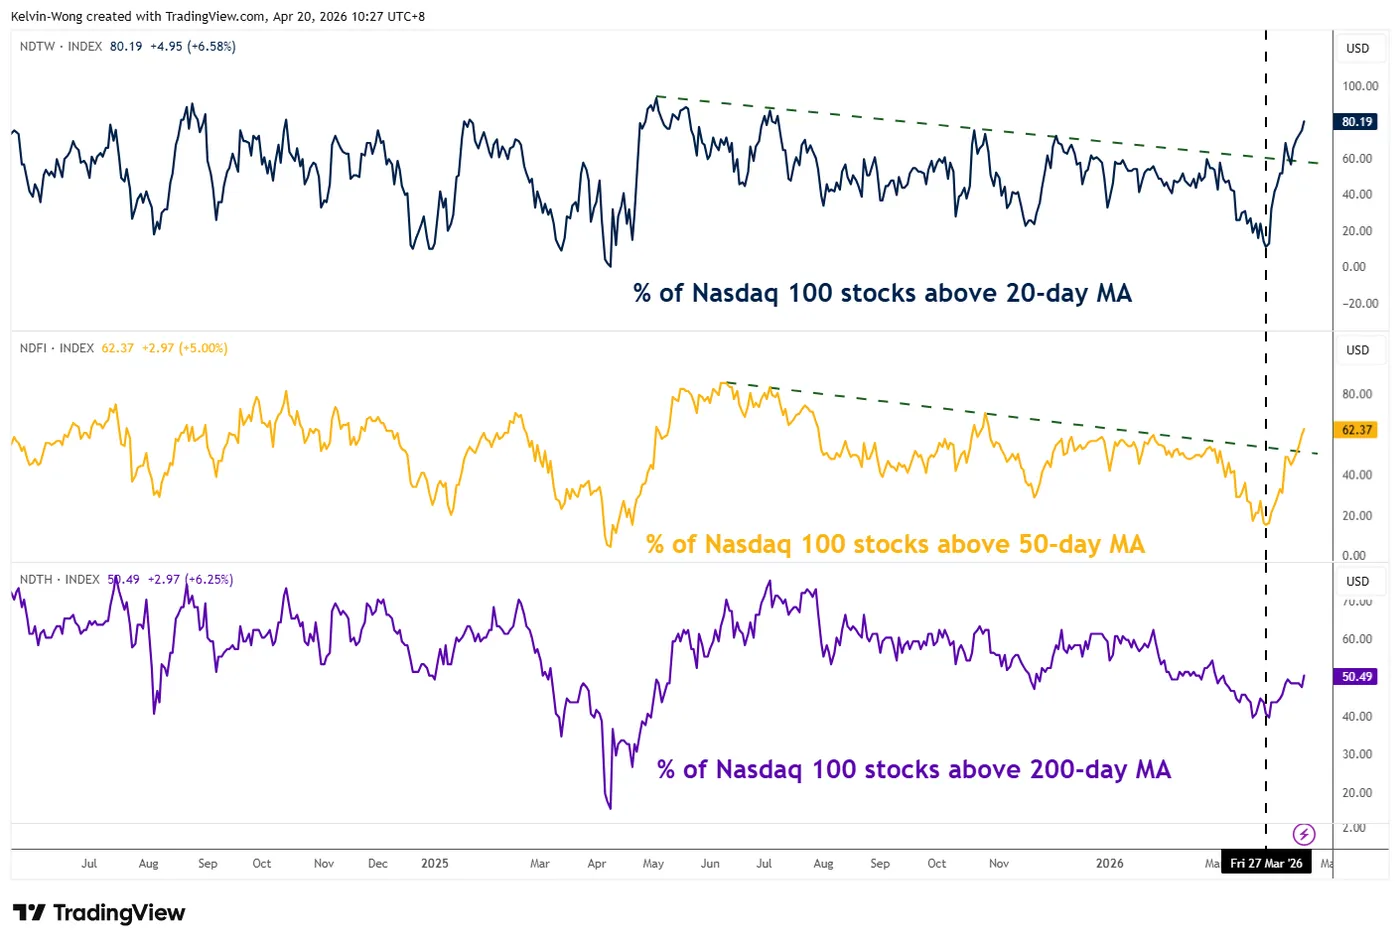
Fig. 2: Percentage of Nasdaq 100 stocks trading above 20-day, 50-day & 200-day moving averages as of 17 Apr 2026 (Source: TradingView).
Over the past five trading sessions, market breadth within the Nasdaq 100 has strengthened markedly, reinforcing the ongoing bullish trend.
The share of component stocks trading above their 20-day and 50-day moving averages has surged from 11% and 15% on 27 March 2026 to 80% and 62%, respectively, as of 17 April 2026 (see Fig. 2).
Similarly, the proportion of stocks above the key 200-day moving average has risen to 50% from 40% over the same period.
Let’s now focus on the short-term trajectory (1 to 3 days) of the US Nasdaq 100 CFD index and its supporting elements from a technical analysis perspective.
Nasdaq 100 – Gapped down but found support at 26,288/142
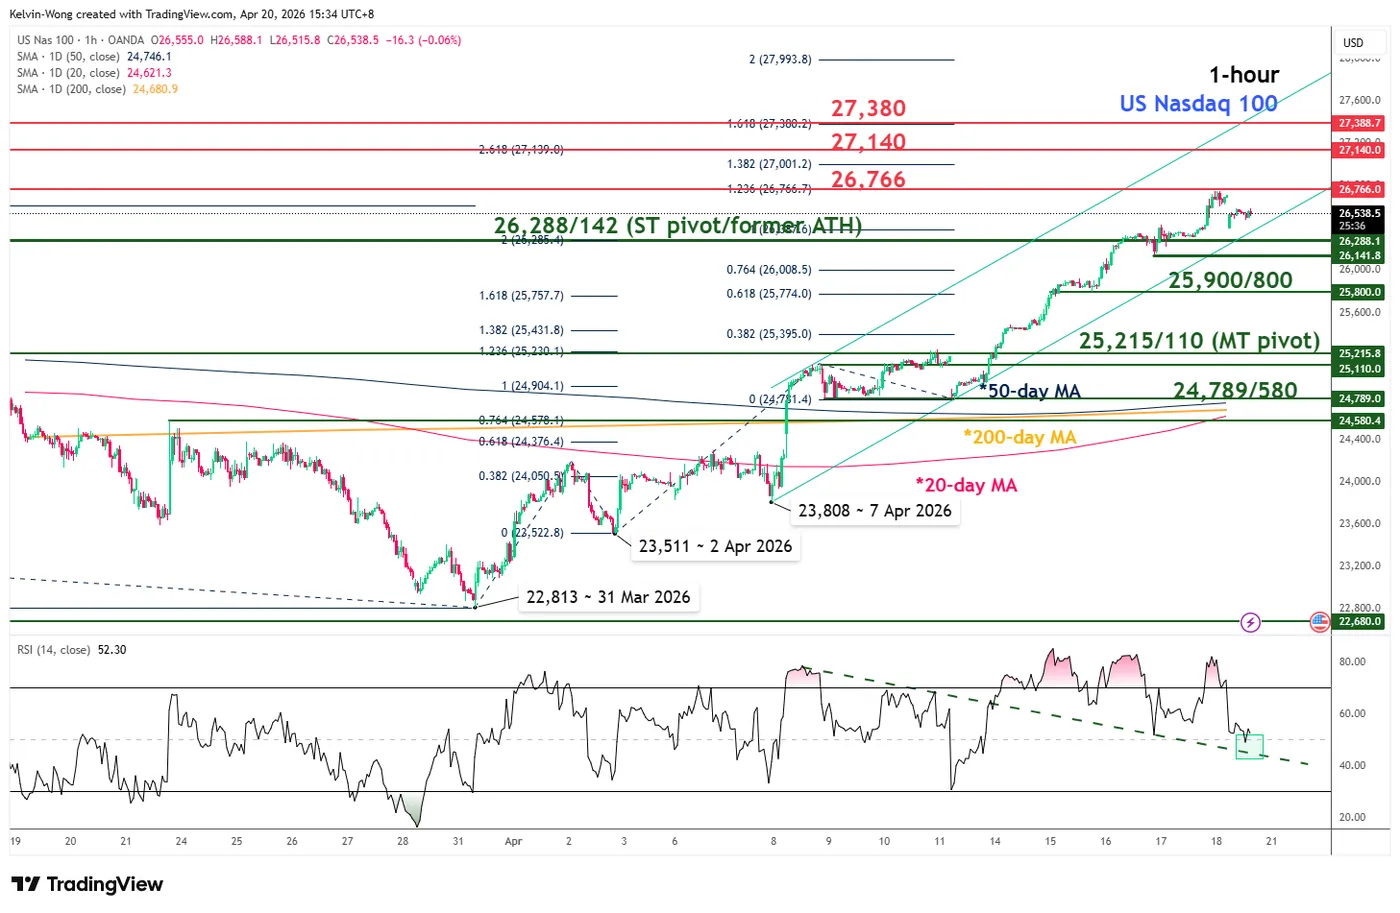
Fig. 3: US Nasdaq 100 CFD index minor trend as of 20 Apr 2026 (Source: TradingView).
The index gapped down by 1.1% at the open of the Asian session on Monday, 20 April 2026, as renewed hostilities in the Strait of Hormuz saw Tehran target vessels and reimpose controls, underscoring a highly fluid US–Iran conflict.
In response, the US Navy engaged and seized an Iranian-flagged cargo ship in the Gulf of Oman, casting fresh doubt over the ceasefire set to expire on Tuesday night (US time).
While US Vice President JD Vance is expected to lead another round of peace talks, Iranian state media reports no plans for participation. Notably, the US Nasdaq 100 CFD index managed to stabilise around its former all-time high of 26,288 at this time of writing.
The price actions of the US Nasdaq 100 CFD index (a proxy of the Nasdaq 100 E-mini futures) have continued to oscillate within a minor ascending channel in place from the 7 April 2026 low of 23,808.
Watch the 26,288/26,142 key short-term pivotal support to maintain its minor bullish acceleration phase for the next intermediate resistances to come in at 26,776, 27,140, and 27,380 (see Fig. 3).
On the flip side, a break and an hourly close below 26,142 invalidates the bullish tone for a minor corrective decline to retest the next intermediate support at 25,900/800. Below 25,800 opens scope for a deeper slide towards the 25,215/25,110 medium-term pivotal support area.
Key elements to support the near-term bullish bias on the Nasdaq 100
- Its price actions have traded above 20-day, 50-day, and 200-day moving averages since 8 April 2026. In addition, the 20-day moving average is now shaping a potential bullish crossover condition above the 50-day and 200-day moving averages.
- The hourly RSI momentum indicator has continued to exhibit a bullish momentum condition above its pull-back support at the 44 level.
- Elliot Wave Theory suggests the recent rally from the 2 April 2026 low of 23,511 is likely considered as a minor bullish impulsive wave three structure with its potential terminal zone at 27,140/27,380 (Fibonacci extension cluster from and the upper boundary of the minor ascending channel).


