
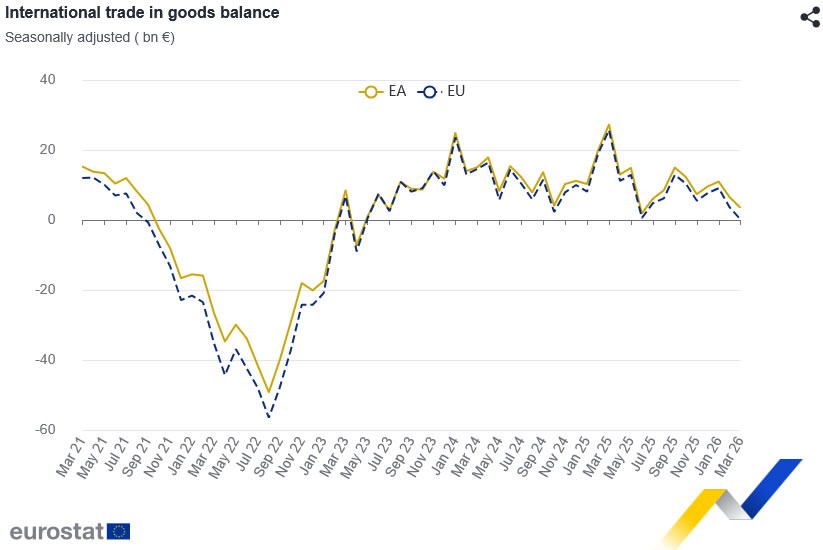
Eurozone trade data deteriorated sharply in March as exports weakened significantly while imports continued rising, highlighting the growing pressure from slowing global demand and escalating trade disruptions. Eurozone recorded a goods trade surplus of EUR 7.8B in March 2026, down dramatically from EUR 34.1B a year earlier. Exports to the rest of the world fell -5.5% yoy to EUR 265.3B, while imports rose 4.4% yoy to EUR 257.4B.
The broader European Union figures painted a similarly weak picture. The EU’s goods trade surplus narrowed from EUR 34.0B to EUR 5.9B as extra-EU exports dropped -8.7% yoy to EUR 233.9B, while imports increased 2.7% yoy to EUR 228.0B.
The deterioration was particularly severe in trade with the United States, where EU exports plunged -37.1% yoy to EUR 45.0B. Although imports from the US edged up only 1.1%, the bilateral trade surplus with the US collapsed from EUR 40.4B a year earlier to EUR 13.5B.
While exports to the UK and Switzerland remained relatively resilient, trade with China continued to show a large structural deficit, with imports from China rising 2.7% while exports slipped -2.3%.
| Indicator | March 2026 (EUR) | Change (yoy) |
|---|---|---|
| Euro Area Trade Balance | 7.8B | |
| Euro Area Exports | 265.3B | -5.5% |
| Euro Area Imports | 257.4B | +4.4% |
| EU Trade Balance | 5.9B | |
| Extra-EU Exports | 233.9B | -8.7% |
| Extra-EU Imports | 228.0B | +2.7% |
Key EU Trading Partners
| Partner | Exports (B) | Export Growth | Imports (B) | Import Growth | Trade Balance (B) |
|---|---|---|---|---|---|
| United States | 45.0 | -37.1% | 31.5 | +1.1% | 13.5 |
| China | 17.7 | -2.3% | 50.3 | +2.7% | -32.6 |
| United Kingdom | 32.9 | +6.9% | 14.9 | +1.1% | 18.0 |
| Switzerland | 23.0 | +10.1% | 13.9 | +11.4% | 9.1 |


