
Key Highlights
- Bitcoin declined heavily below $80,000 before the bulls emerged.
- A few hurdles are forming near $78,200 and $79,000 on the 4-hour chart of BTC/USD.
- Ethereum remains in a bearish zone below $2,400.
- Gold extended losses before the bulls took a stand near $4,465.
Bitcoin Price Technical Analysis
Bitcoin price failed to stay above $81,200 against the US Dollar. BTC reacted to the downside below $80,000 and $79,000.
Looking at the 4-hour chart, the price dipped below a declining channel with support at $78,500. The price even settled below $79,000, the 100 simple moving average (red, 4-hour), and the 200 simple moving average (green, 4-hour).
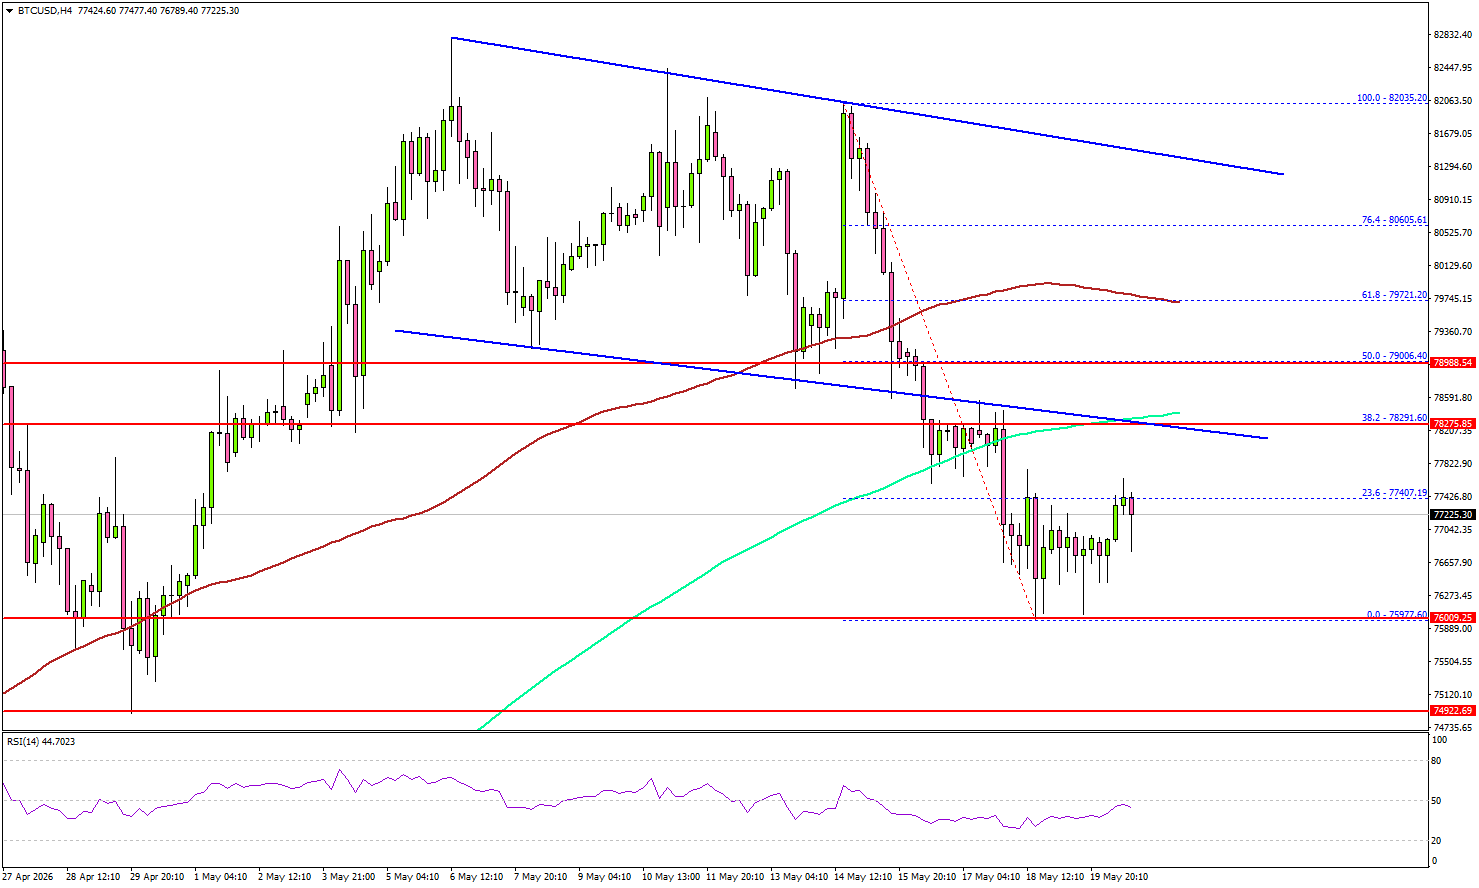
A low was formed at $75,977, and the price is now consolidating losses below the 38.2% Fib retracement level of the recent decline from the $82,035 swing high to the $75,977 low.
On the upside, the price now faces resistance near $78,200, the same channel, and the 200 simple moving average (green, 4-hour). The first key hurdle could be $79,000 and the 50% Fib retracement level of the recent decline from the $82,035 swing high to the $75,977 low.
A close above $79,000 could send the price toward $80,500. Any more gains might call for a test of $82,000. Immediate support sits at $76,500. The first key support could be $76,000. The main breakdown support could be $75,000.
A downside break below $75,000 might start another decline. The next major support might be $72,000, below which BTC could decline toward $70,000.
Looking at Ethereum, the price also gained bearish momentum below $2,300 and remains at risk of more downside.
Today’s Key Economic Releases
- US Initial Jobless Claims – Forecast 210K, versus 211K previous.
- US S&P Global Manufacturing PMI for June 2026 (Preliminary) – Forecast 54.0, versus 54.5 previous.
- US S&P Global Services PMI for June 2026 (Preliminary) – Forecast 51.0, versus 51.0 previous.


