
Key takeaways
- Global equities climbed to fresh record highs as optimism surrounding ongoing U.S.-Iran diplomatic negotiations combined with relentless AI-driven capital expenditure, boosting major indices including the S&P 500, Nasdaq, MSCI World, and Nikkei 225.
- The U.S. economy is displaying an increasingly pronounced “K-shaped” divergence, where AI-fuelled corporate investment and profits continue to surge. At the same time, consumer savings have fallen to near their lowest levels since the Global Financial Crisis, raising concerns about the sustainability of consumer spending.
- Market leadership has become highly concentrated in technology and AI-related sectors, with Nvidia, Dell, Oracle, and other AI beneficiaries driving index gains. In contrast, most other sectors lag, highlighting growing concentration risk beneath record-high equity indices.
- Chart of the day: USD/JPY’s 4-week is losing upside momentum with risk of a minor corrective setback below 159.85 key short-term resistance.
Top macro headlines
- World benchmarks stock indices scale all-time highs on Trump assurances: Global risk sentiment exploded on Monday as the big three U.S. stock indices joined the MSCI World, MSCI EM, and Japan’s Nikkei in hitting new historic records. The broad advance followed statements from U.S. President Donald Trump indicating that, despite fresh weekend military exchanges, Washington and Tehran remain engaged in active diplomatic discussions.
- U.S. manufacturing activity expands at 4-Year High: Defying structural headwinds from the regional oil shock and record-low consumer confidence, figures released on Monday showed that U.S. manufacturing activity is growing at its fastest pace in four years. ISM Manufacturing PMI for May rose to 54.0 versus 52.7 in April, and came in above expectations of 53. The brisk expansion is being driven primarily by immense, front-loaded corporate capital expenditures in artificial intelligence.
- Anthropic leads flurry of multi-trillion dollar IPO filings: Wall Street’s AI frenzy reached a new milestone as generative AI champion Anthropic confidentially filed for a U.S. initial public offering. With OpenAI preparing a parallel filing and SpaceX set to price its record-breaking listing later this month, institutional desks calculate that up to $4 trillion of new market capitalisation could debut in the coming weeks.
- NVIDIA moves AI edge computing directly to the PC Market: Shifting the competitive landscape for hardware developers, NVIDIA unveiled a new specialised architecture chip engineered to embed generative AI capabilities directly into standard laptops and desktop personal computers.
- U.S. consumer savings pool erased to pre-crisis low: Highlighting a severe “K-shaped” economic divergence, real economic metrics show the U.S. personal savings rate has plummeted to a four-year low of 2.6%. Excluding a brief anomaly in June 2022, the buffer is now tracking at its lowest overall absolute level since the 2008 global financial crisis.
Key macro themes
- The multi-speed K-shaped consumer chasm: While corporate America, riding the AI infrastructure boom, enjoys near-historic profit expansions, everyday consumers are facing severe cost-of-living constraints. The rapid rate at which the population is depleting its savings buffers to sustain retail spending is a flashing warning to macroeconomists that current domestic consumption models are structurally unsustainable.
- The imbalance in extreme sector equity concentration: Although broad market averages notched pristine records, the underbelly of Monday’s Wall Street session exposed highly fragile technical leadership. Only two out of the S&P 500’s 11 major sectors finished in positive territory: technology (+2.5%) and energy (+1.9%). The remaining nine sectors fell broadly on Monday, 1 June, led by a 3% plunge in defensive utilities and a 2.6% drop in consumer discretionaries.
- Geopolitical supply volatility and the energy buffer draw: Renewed weekend military strikes between the U.S. and Iran in Kuwait and Lebanon instantly revived global supply anxieties. It comes at a highly critical juncture for physical fuel markets, where a historic 15-week streak of national gasoline stockpile drawdowns has left the system without an operational buffer heading into peak summer driving season.
Global market impact (last 24 hours)
Equities: Wall Street’s indices pushed to record closings, spearheaded by specialised tech clusters. Major individual corporate gainers included Dell (+10%), Oracle (+10%), and Nvidia (+6%), while Micron topped the historic $1,000 threshold. Hewlett-Packard exploded by 28% in after-hours trade following earnings. Conversely, hardware laggards included Qualcomm (-9%), Meta (-5%), and Intel (-5%). Europe and the UK finished lower on Monday, 1 June; DAX (-0.4%), FTSE 100 (-0.7%).
Fixed Income: Sovereign bond markets faced steady selling pressure. Strong local manufacturing activity and structural stagflationary elements pushed U.S. Treasury yields up across the curve by as much as 3 basis points.
FX: The U.S. Dollar Index displayed broad upward dominance. The USD/JPY pair advanced aggressively toward the critical 160.00 intervention threshold. The New Zealand Dollar (Kiwi) and Swedish Krona dropped close to 1.0% to pace G10 losses, while the Argentine Peso (-1.5%) led emerging market declines.
Commodities: Crude oil prices spiked violently on geopolitical backsliding. Global benchmark Brent and WTI crude surged by 4%-5%. Non-yielding spot gold retreated by 1,2% after the rejection of its 20-day moving average to close at $4,485/oz on Monday, 1 June, on the backdrop of firmer US Treasury yields.
Asia Pacific impact
- Stock markets break higher: Regional indices captured strong positive spillover from global tech allocations. The MSCI Asia ex-Japan index climbed to a historic high, with Japan’s Nikkei 225 establishing fresh record peaks and South Korea’s benchmark KOSPI index exploding by 4.0% in a massive single-session breakout. In today’s Asia opening session, profit-taking has emerged amid conflicting narratives on the progress of US-Iran peace talks; Nikkei 225 (-1.1%), KOSPI (-1.1%), China A50 (-1%), ASX 200 (-1%). In comparison, STI bucked the trend with an intraday gain of 0.3%.
- Macro energy strains and imports: The severe commodity spike imposes immediate burdens on regional trading balances. Data show that China’s crude oil imports plummeted to a 10-year low in May, driven by worsening domestic economic conditions and high international invoice costs.
Top 3 events to watch today
- Eurozone Core Inflation Rate Prelim (May) – 5:00 pm SGT (consensus: 2.4% y/y, Apr: 2.2%) Impact: EUR/USD, EUR crosses, DAX
- Fed Speak (Hammack) – 8:30 pm SGT Impact: USD, Short-term US Treasuries, US stock indices
- US-Iran peace deal progress news flows Impact: All asset classes.
Chart of the day – USD/JPY is losing upside momentum
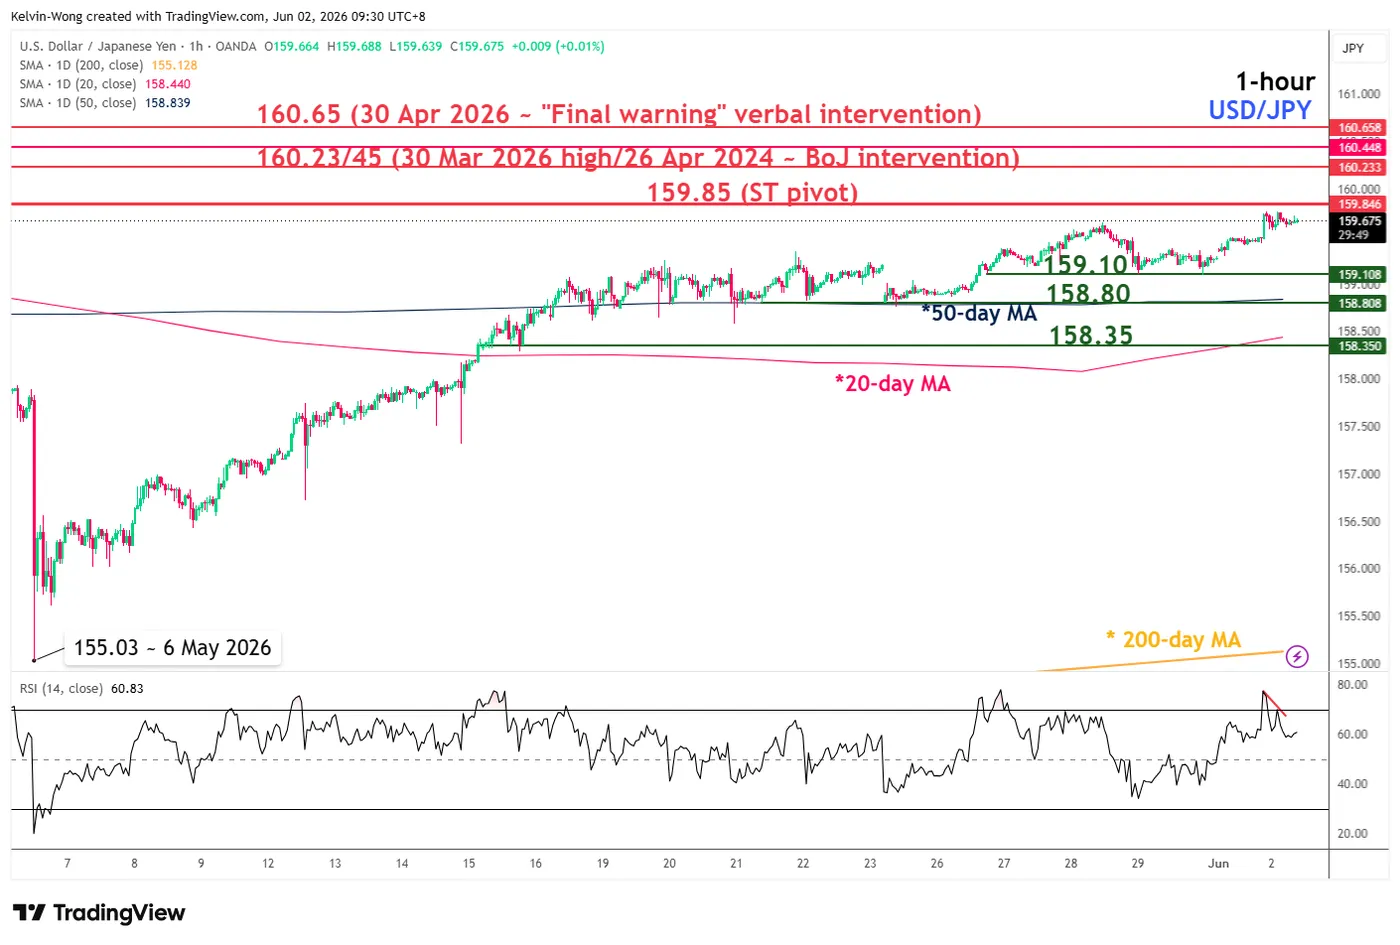
Fig. 1: USD/JPY minor trend as of 2 Jun 2026 (Source: TradingView).
The 3% rally in USD/JPY from its intraday low of 155.03 on 6 May 2026 is now showing signs of minor exhaustion.
The hourly RSI momentum indicator flashed out a prior bearish divergence condition and exited its overbought level on Monday, 1 June 2026.
Watch the 159.85 key short-term pivotal resistance with risk of a corrective setback towards the intermediate supports of 159.10 and 158.80 (also the 50-day moving average) (see Fig. 1).
However, a break and an hourly close above 159.85 invalidates the setback scenario and opens the door for a squeeze up towards the next intermediate resistances/prior intervention zones at 160.23/45 and 160.65.


