
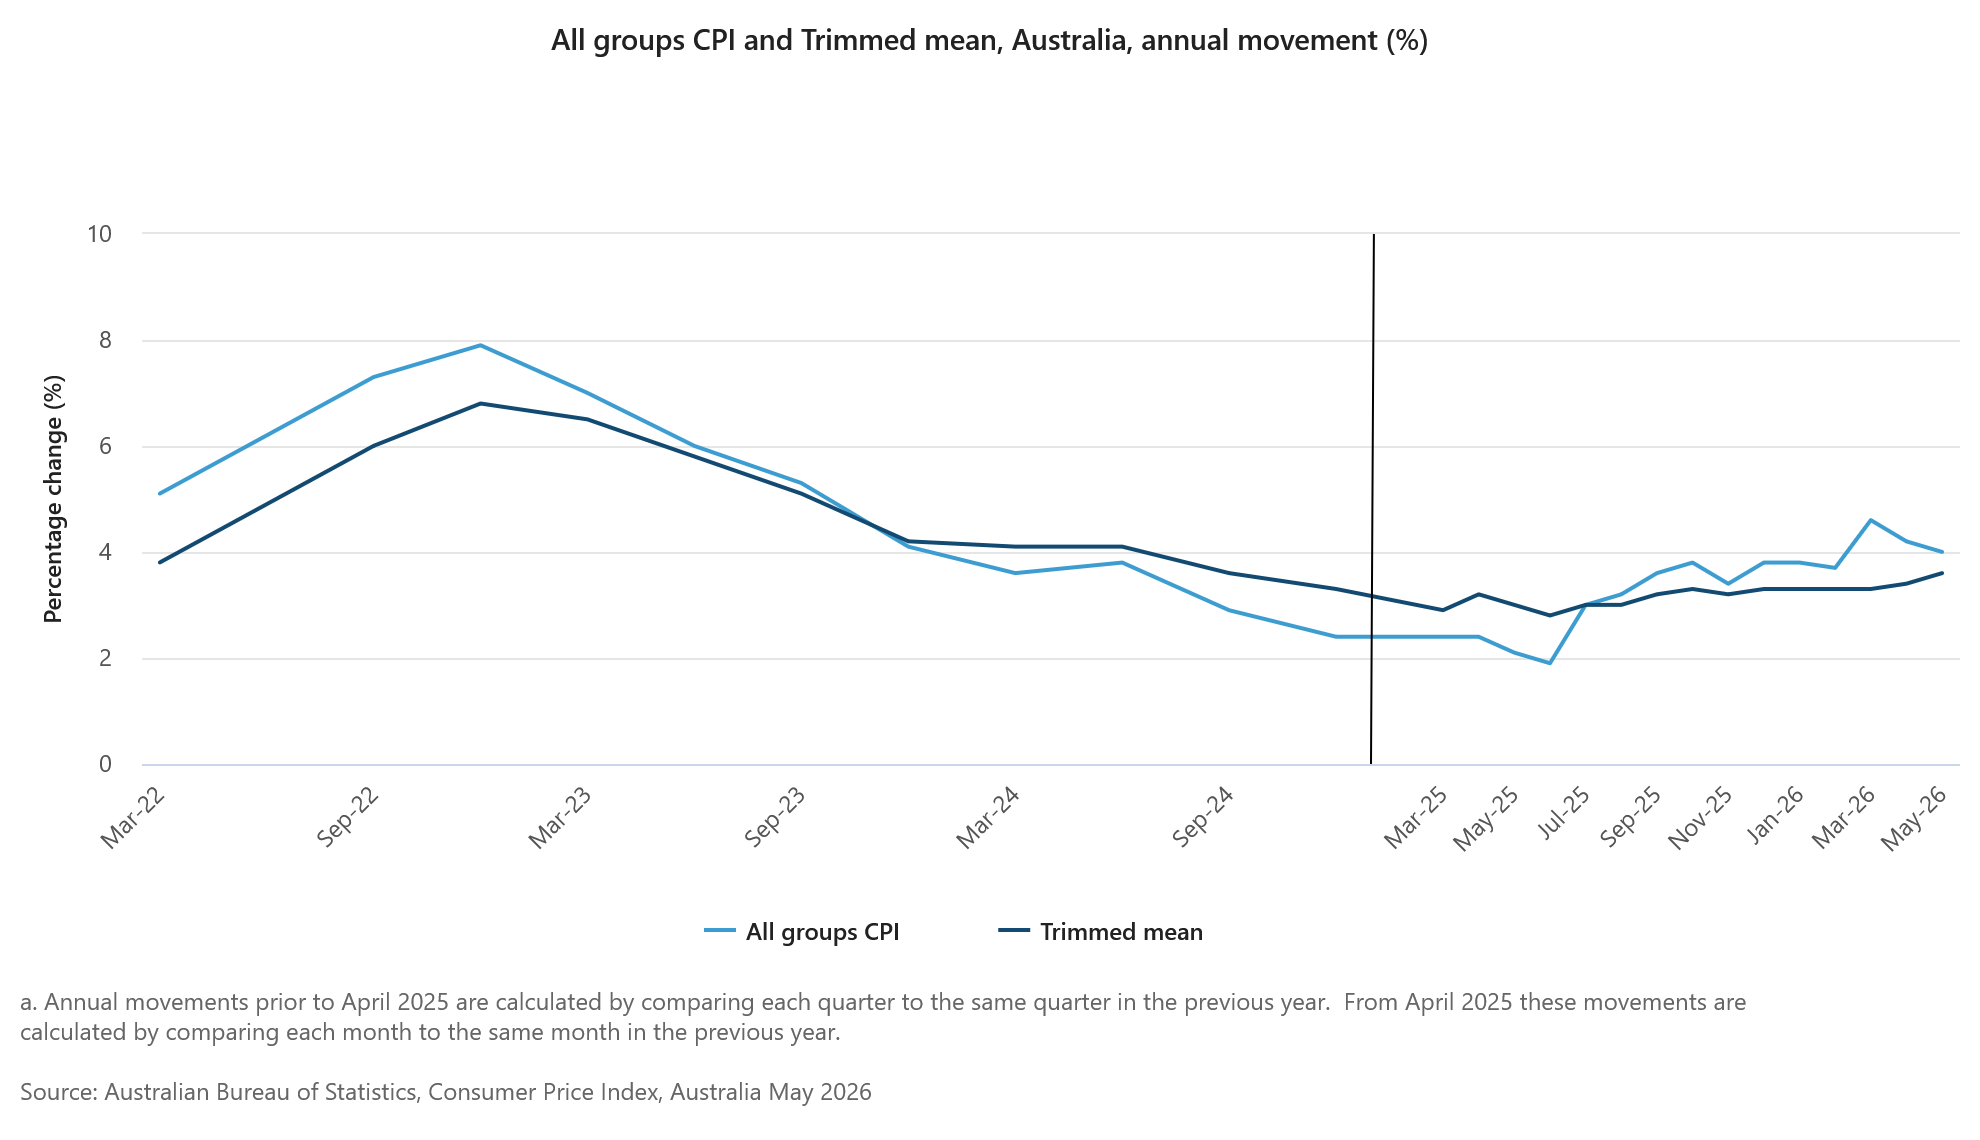
Australia’s May inflation report delivered something for both doves and hawks. On the surface, the numbers looked encouraging. Headline CPI fell -0.7% mom and annual inflation slowed from 4.2% yoy to 4.0% yoy, both coming in below market expectations. Much of that improvement came from the collapse in fuel prices, with automotive fuel costs plunging -11.9% during the month after a -7.0% fall in April. Lower global oil prices and the government’s fuel excise reduction combined to deliver a powerful disinflationary boost.
The deeper story, however, was much less reassuring. The RBA’s preferred trimmed mean measure rose 0.4% mom, exceeding expectations. Annual trimmed mean inflation accelerated from 3.4% yoy to 3.6% yoy, and reached the highest level since late 2024. In other words, the decline in headline inflation was largely driven by energy-related factors rather than a broad-based easing in domestic price pressures. That distinction matters because policymakers are focused on whether underlying inflation is becoming embedded in the economy.
The split between goods and services inflation highlights the challenge. Goods inflation eased from 4.7% yoy to 4.2% yoy as lower fuel prices filtered through the economy. Services inflation moved in the opposite direction, accelerating from 3.5% yoy to 3.7% yoy. Housing was the biggest contributor to overall inflation, rising 6.5% yoy, while food and transport costs also remained elevated.
The report is unlikely to provide a decisive answer on whether the RBA is finished tightening. Instead, it reinforces the central debate facing policymakers: headline inflation is moving lower, but the underlying inflation problem has yet to show convincing signs of fading.
| Indicator | April | May | Market Expectation |
|---|---|---|---|
| CPI (m/m) | 0.4% | -0.7% | -0.4% |
| CPI (y/y) | 4.2% | 4.0% | 4.3% |
| Trimmed Mean CPI (m/m) | 0.3% | 0.4% | 0.3% |
| Trimmed Mean CPI (y/y) | 3.4% | 3.6% | 3.6% |
| Goods Inflation (y/y) | 4.7% | 4.2% | — |
| Services Inflation (y/y) | 3.5% | 3.7% | — |
| Automotive Fuel Prices (m/m) | -7.0% | -11.9% | — |


