
Key Highlights
- Bitcoin extended losses below $60,000 before it found some support.
- BTC/USD could be following a bearish flag with resistance at $61,500 on the 4-hour chart.
- Ethereum settled well below $1,650 with a bearish angle.
- XRP tested the $1.00 support and shows signs of consolidation.
Bitcoin Price Technical Analysis
Bitcoin price extended losses and traded below $60,000 against the US Dollar. BTC tested the $58,000 zone and recently started a minor recovery wave.
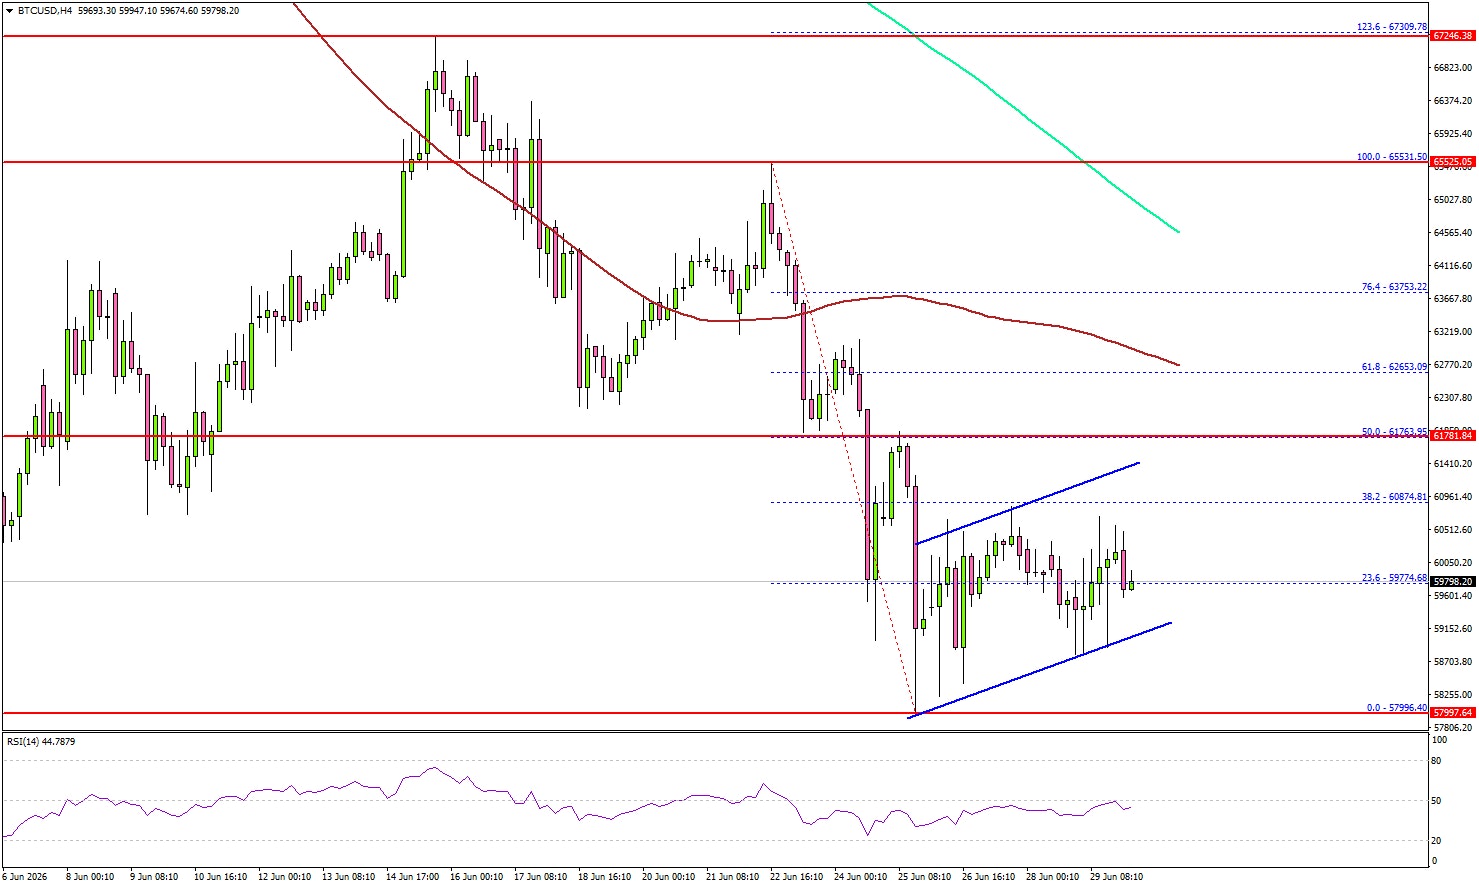
Looking at the 4-hour chart, the price settled well below $62,000, the 100 simple moving average (red, 4-hour), and the 200 simple moving average (green, 4-hour). The price started a minor recovery wave above the 23.6% Fib retracement level of the downward move from the $65,531 swing high to the $57,996 low.
However, the bears might remain active below the $62,000 pivot level. On the upside, an immediate resistance could be $60,850. The first major resistance might be $61,500.
There is also a bearish flag forming with resistance at $61,500. The main resistance sits near $62,000 and the 50% Fib retracement level. A close above $62,000 could send the price toward $62,800. Any more gain might call for a test of $65,000.
If there is a fresh decline, immediate support might be $59,000. The first key support could be $58,200. The main breakdown support could be $58,000. A downside break below $58,000 might start another decline. The next major support might be $56,500, below which BTC could decline toward $55,000.
Looking at Ethereum, the price started a consolidation phase and could face many hurdles near $1,620 and $1,650.
Today’s Key Economic Releases
- US Housing Price Index for April 2026 (MoM) – Forecast +0.1%, versus +0.1% previous.
- Chicago Purchasing Manager’s Index for June 2026 – Forecast 60.0, versus 62.7 previous.


