


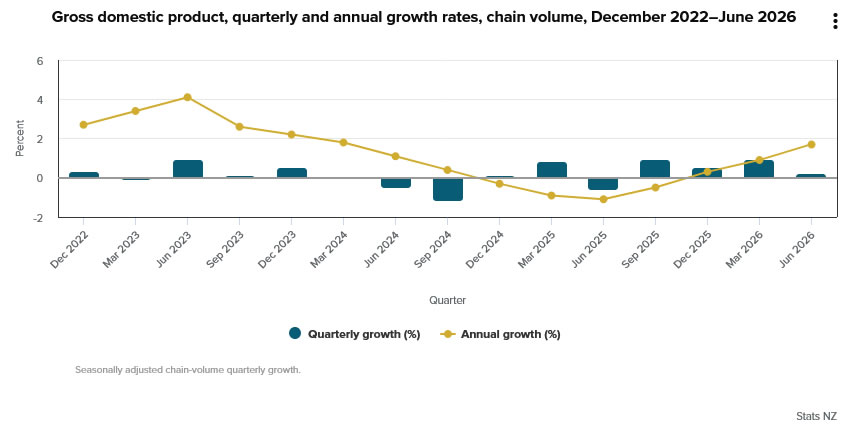
New Zealand GDP growth slowed from an upwardly revised 0.9% to 0.2% quarter on quarter in the June quarter, slightly exceeding expectations for a 0.1% increase. Nine of 16 industries expanded, while GDP per capita rose 0.1%. Annual-average growth stood at 1.7% in the year ended June, while output was 2.6% higher than in the same quarter of 2025.
Growth was led by construction, which increased 2.7% on stronger residential building activity. Public administration and safety rose 2.0%, while wholesale trade gained 1.3%. On the expenditure side, exports advanced 3.3% and fixed investment increased 1.5%. However, household consumption rose only 0.1%, total private consumption was unchanged, transport and warehousing contracted 1.7%, and retail trade and accommodation fell 1.0%.
The positive GDP headline therefore masked renewed pressure on purchasing power. Real gross national disposable income fell 0.4%, while the per-capita measure dropped 0.6%, as import prices surged 13.8% against a 3.5% rise in export prices. Stats NZ linked the deterioration partly to Middle East-driven fuel costs, which also weighed on transport, fuel-retailing volumes and discretionary services. The result shows the economy avoiding stagnation, but does not yet establish a broadly based recovery in domestic demand.
Data summary
| Indicator | Actual | Expected | Previous |
|---|---|---|---|
| Production GDP q/q | 0.2% | 0.1% | 0.9%* |
*March-quarter growth was revised from 0.8% to 0.9%.
Additional GDP measures
| Indicator | June quarter |
|---|---|
| Expenditure GDP q/q | 0.4% |
| GDP per capita q/q | 0.1% |
| GDP y/y | 2.6% |
| Annual-average GDP growth | 1.7% |
| Real gross national disposable income q/q | -0.4% |
| Real disposable income per capita q/q | -0.6% |
Production breakdown
| Industry | June quarter |
|---|---|
| Construction | 2.7% |
| Public administration and safety | 2.0% |
| Wholesale trade | 1.3% |
| Healthcare and social assistance | 0.8% |
| Manufacturing | 0.4% |
| Primary industries | -0.3% |
| Retail trade and accommodation | -1.0% |
| Transport, postal and warehousing | -1.7% |
Expenditure breakdown
| Component | June quarter |
|---|---|
| Exports | 3.3% |
| Gross fixed capital formation | 1.5% |
| Household consumption | 0.1% |
| Private consumption | 0.0% |
| Imports | -0.8% |
| General government expenditure | -1.7% |
Key takeaways
- New Zealand GDP grew 0.2%, slightly exceeding expectations of 0.1%, but slowed sharply from the revised 0.9% expansion in the March quarter.
- Growth was uneven, with only nine of 16 industries recording increases.
- Construction was the principal driver, supported by stronger residential building. Exports and fixed investment also contributed positively.
- Household consumption grew only 0.1%, while total private consumption was unchanged, showing little domestic-demand momentum.
- Transport and retail-related industries contracted as higher fuel costs weighed on volumes and discretionary spending.
- Real gross national disposable income fell 0.4%, while the per-capita measure dropped 0.6% as import prices rose much faster than export prices.
- The headline beat shows that New Zealand avoided stagnation, but weak consumption and falling purchasing power leave the broader recovery fragile.





