


TL;DR: Silver’s $60 floor should hold unless gold breaks first. A structural physical-market deficit gives the $60–60.44 zone real backing, but the most credible path to a break runs through a hawkish Fed SEP, gold losing its $4,230–4,254 support, and the Gold/Silver ratio magnifying the fallout.
Silver Approaches a Defensible Floor
Silver’s $60 floor should hold unless gold breaks first. With silver trading in the low $62s, the psychological threshold is reinforced by a technical projection at $60.44. Continued selling could bring that zone into view, but a decisive break probably requires more than ordinary downward drift. The most credible route runs through a hawkish Federal Reserve outcome, higher real yields, and a corresponding breakdown in gold.
The physical market provides structural support for that base case. According to the Silver Institute’s World Silver Survey 2026, the market recorded its fifth consecutive annual deficit in 2025, at 40.3 million ounces, while a wider 46.3 million-ounce deficit is forecast for 2026. Above-ground inventories have fallen by a cumulative 762.1 million ounces since 2021.
Those deficits don’t prevent a short-term decline or guarantee any particular technical level will hold. They do, however, strengthen the downside asymmetry. Mine supply is relatively unresponsive because most silver is produced as a byproduct of gold, copper, and zinc mining. Industrial demand from electronics and solar manufacturing is also unlikely to change abruptly in response to short-term price movements. That gives the $60–60.44 zone more fundamental backing than a purely arbitrary round number.
The Fed Is the Cause, but Gold Is the Trigger
Wednesday’s expected rate increase isn’t the central risk. A hike is already priced at roughly 90% across major market venues, making the decision itself largely a confirmation event. The more important question is whether the Federal Reserve’s Summary of Economic Projections shows officials expect tightening to continue after September.
The June projections placed the median year-end rate at 3.8%, consistent with approximately one increase during 2026. Nine of the 18 officials submitting projections expected at least one hike. Federal Reserve Chair Kevin Warsh is expected to withhold his individual projection again, leaving the remaining participation count important when interpreting any change in the median.
A median above the new 3.75–4.00% target range would indicate the committee itself expects another move in October or December. Three officials dissented in favor of tightening in July, up from two in June, keeping the possibility of a higher median firmly in play. The Reuters survey reversal reinforces the change in the market backdrop: 85% of respondents now expect a September hike, while 53% expect at least one further increase by the end of March 2027.
For silver, however, the immediate transmission point isn’t the dot plot by itself. It’s gold’s $4,230–4,254 support zone.
ActionForex’s Technical View on Gold: Already at Its Decision Zone
Gold is trading near $4,267, only around $13 above the first important support at $4,254.53. That level represents the 61.8% projection of the decline from $4,697.07 to $4,282.23, projected from $4,510.90. Slightly below it, the 61.8% retracement of the rise from $3,942.43 to $4,697.07 stands at $4,230.70.
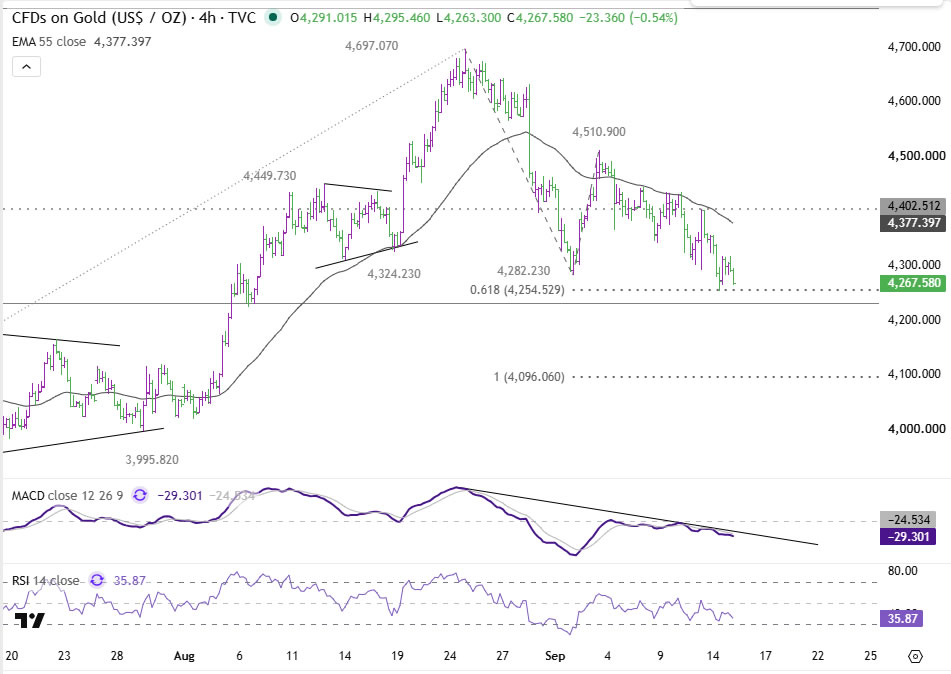
This creates a genuine support zone rather than two versions of the same calculation. If a hawkish SEP drives gold decisively through $4,230, the decline would be positioned to accelerate toward the 100% projection at $4,096.06. Silver would then face a direct correlation shock at precisely the point when its own $60 support is coming into reach.
Gold’s four-hour momentum doesn’t yet show an accelerating collapse. RSI stands at 35.87, leaving further downside before oversold conditions emerge, while MACD remains below its signal line without a visibly widening gap. The pattern is therefore one of persistent pressure rather than capitulation. On the upside, the falling 55-period EMA around $4,377 and fixed resistance at $4,402.51 should now be treated as separate barriers rather than a single confluence zone.
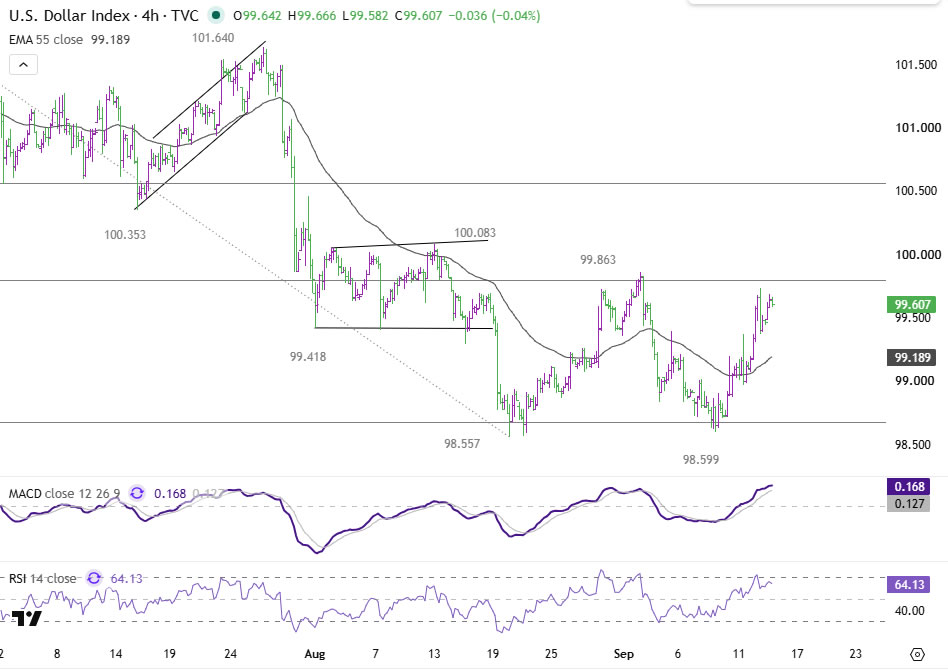
The Dollar Index provides a secondary confirmation signal. A decisive break above the 99.79–99.86 resistance zone would complete its double-bottom formation and open the way toward 100.56. A subsequent break above 100.56 would reinforce the case for gold to lose support, although gold doesn’t necessarily have to wait for the Dollar to reach that level. The current pressure may already be arriving directly through Treasury yields and real rates.
Oil Determines How Far the Chain Runs
Oil is best understood as a variable within the same Fed-and-yields mechanism, not as an independent silver catalyst. BMO Capital Markets calculated that the one-month rolling correlation between WTI and the US 10-year Treasury yield had climbed to 0.96, its highest since June 2019. Under current conditions, higher oil prices are feeding directly into inflation expectations, rate pricing, and financial conditions.
Further geopolitical escalation, a continued closure of Saudi Arabia’s East-West pipeline, or another disruption around the Strait of Hormuz would strengthen the case for additional Fed tightening. That would place more pressure on gold’s support and raise the probability of silver falling through $60.
The relationship can also work in reverse. Genuine de-escalation would reduce energy-driven inflation pressure and allow real yields to ease, reinforcing support for precious metals. The unusually strong oil-yield correlation is based on a relatively short window and could weaken quickly if markets begin emphasizing growth risks rather than inflation risks. Oil therefore determines how forcefully the chain operates, but it can cut in either direction.
The Gold/Silver Ratio Signals Greater Silver Sensitivity
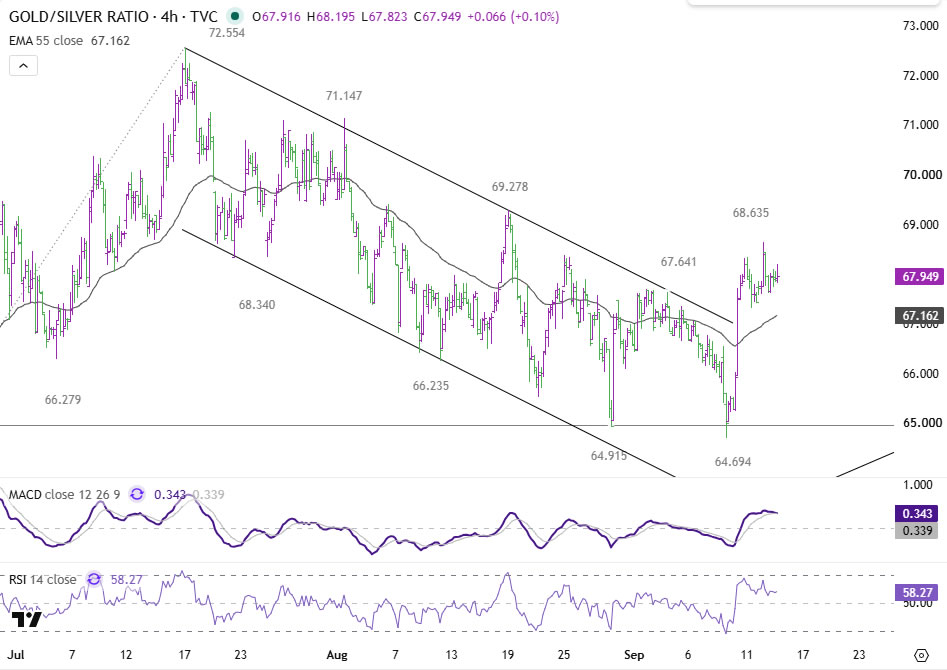
The Gold/Silver ratio has broken above its descending channel, rallied to 68.635, and pulled back to test the former upper trendline around 67.641. It’s currently holding above that line near 67.95, while also remaining above its four-hour 55-period EMA around 67.16.
Momentum has stabilized rather than reversed. MACD is marginally above its signal line, while RSI has cooled to 58.27 without falling below 50. The breakout has therefore passed its first retest, although the confirmation isn’t yet decisive.
This ratio doesn’t provide the initial catalyst for silver to break $60. Instead, it describes the likely magnitude of silver’s response if gold loses support. A sustained rise in the ratio would indicate silver is continuing to underperform gold, allowing a moderate gold decline to produce a larger percentage fall in silver.
AI Demand Is Not a Near-Term Breakdown Trigger
Concerns about slower AI development don’t currently provide a convincing industrial-demand case for silver to fall below $60. Copper, which has a more direct connection to data-center investment, hasn’t shown a clear demand-driven response to this week’s AI debate. Its outsized decline has instead been linked to the delayed US decision on refined-copper tariffs and the unwinding of a crowded stockpiling trade.
A sustained, multi-quarter reduction in hyperscaler capital expenditure would eventually matter for industrial metals. An AI-sentiment wobble or open letter doesn’t establish such a shift.
There’s an important distinction between AI-related industrial demand and AI-related risk aversion. The former isn’t yet a credible silver catalyst. The latter could matter indirectly if a broader equity selloff generates demand for the Dollar and pushes real yields higher. Even then, the transmission would still run through financial conditions rather than an immediate reassessment of silver consumption.
ActionForex’s Technical View on Silver
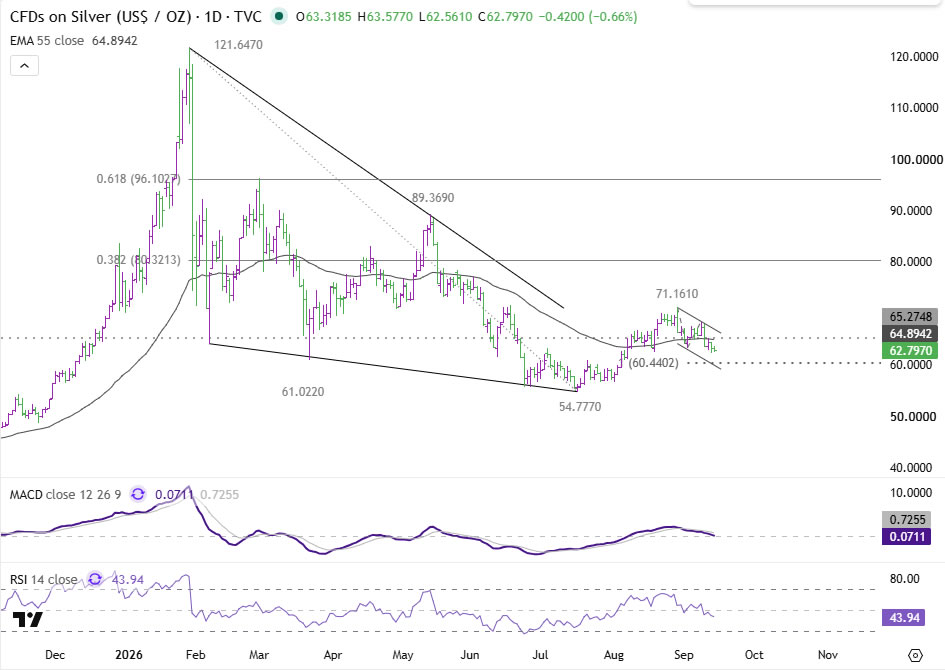
Silver’s decline from $71.1610 remains in progress on the four-hour chart. The 100% projection of the fall from $71.1610 to $63.2792, measured from $68.3220, lands at $60.4402. Its proximity to the $60 psychological threshold makes $60.00–60.44 the principal near-term support zone.
Four-hour RSI at 37.77 and daily RSI at 43.94 show silver is weakening without reaching a clear technical extreme. Price is also below the daily 55-day EMA near $64.89 and the four-hour 55-period EMA near $65.16, leaving the immediate bias on the downside.
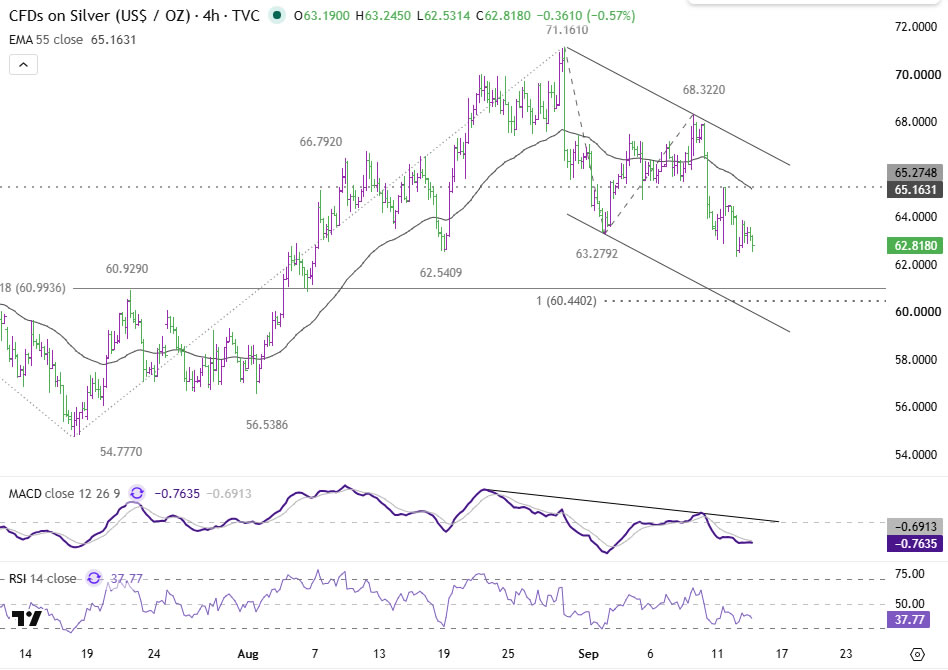
An initial recovery above the recent $63.28 area would suggest selling pressure is stabilizing. Stronger rebound confirmation would require a break through the moving-average cluster between $64.89 and $65.16, followed by resistance near $65.27. Until that happens, a test of $60–60.44 remains possible even if the zone ultimately holds.
A decisive break below $60.00–60.44 would invalidate the near-term-floor thesis. But the chart suggests such a move would most credibly follow a specific sequence: a hawkish SEP lifts real yields, gold breaks $4,230–4,254, and the rising Gold/Silver ratio magnifies silver’s decline.
A Conditional Floor, Not a Guarantee
The hierarchy is straightforward. The SEP and gold’s $4,230–4,254 support zone provide the principal mechanism. Oil determines how forcefully that mechanism operates. The Gold/Silver ratio indicates how much silver could underperform if it fires. AI-related industrial-demand concerns aren’t currently strong enough to break the floor independently.
Absent that chain, $60–60.44 remains a reasonable base for silver. It’s not a guarantee the correction has ended. It’s a conditional floor whose failure requires identifiable confirmation—beginning with gold.
Key Takeaways
- Silver’s fifth consecutive annual physical deficit (40.3M oz in 2025, 46.3M forecast for 2026) gives the $60-60.44 zone genuine structural backing, not just a round-number floor.
- Wednesday’s Fed hike is already priced at roughly 90%; the real risk to silver is whether the SEP median rises above 3.75-4.00%, signaling more tightening beyond September.
- Gold sits just $13 above its first key support at $4,254.53, with $4,230.70 as the deeper level; a break there would be the direct transmission point into silver.
- The WTI-10-year yield correlation has climbed to 0.96, its highest since June 2019, meaning oil now determines how forcefully the Fed-yields-gold-silver chain operates.
- The Gold/Silver ratio’s breakout above its descending channel suggests silver would underperform disproportionately if gold’s support breaks, though AI-related demand fears aren’t yet a credible standalone trigger.





