


USDJPY delivered a textbook Elliott Wave setup, plunging over 700 pips in a powerful downward expansion after completing its corrective recovery structure.
Identifying the Turning Point at 160.00 – 161.00
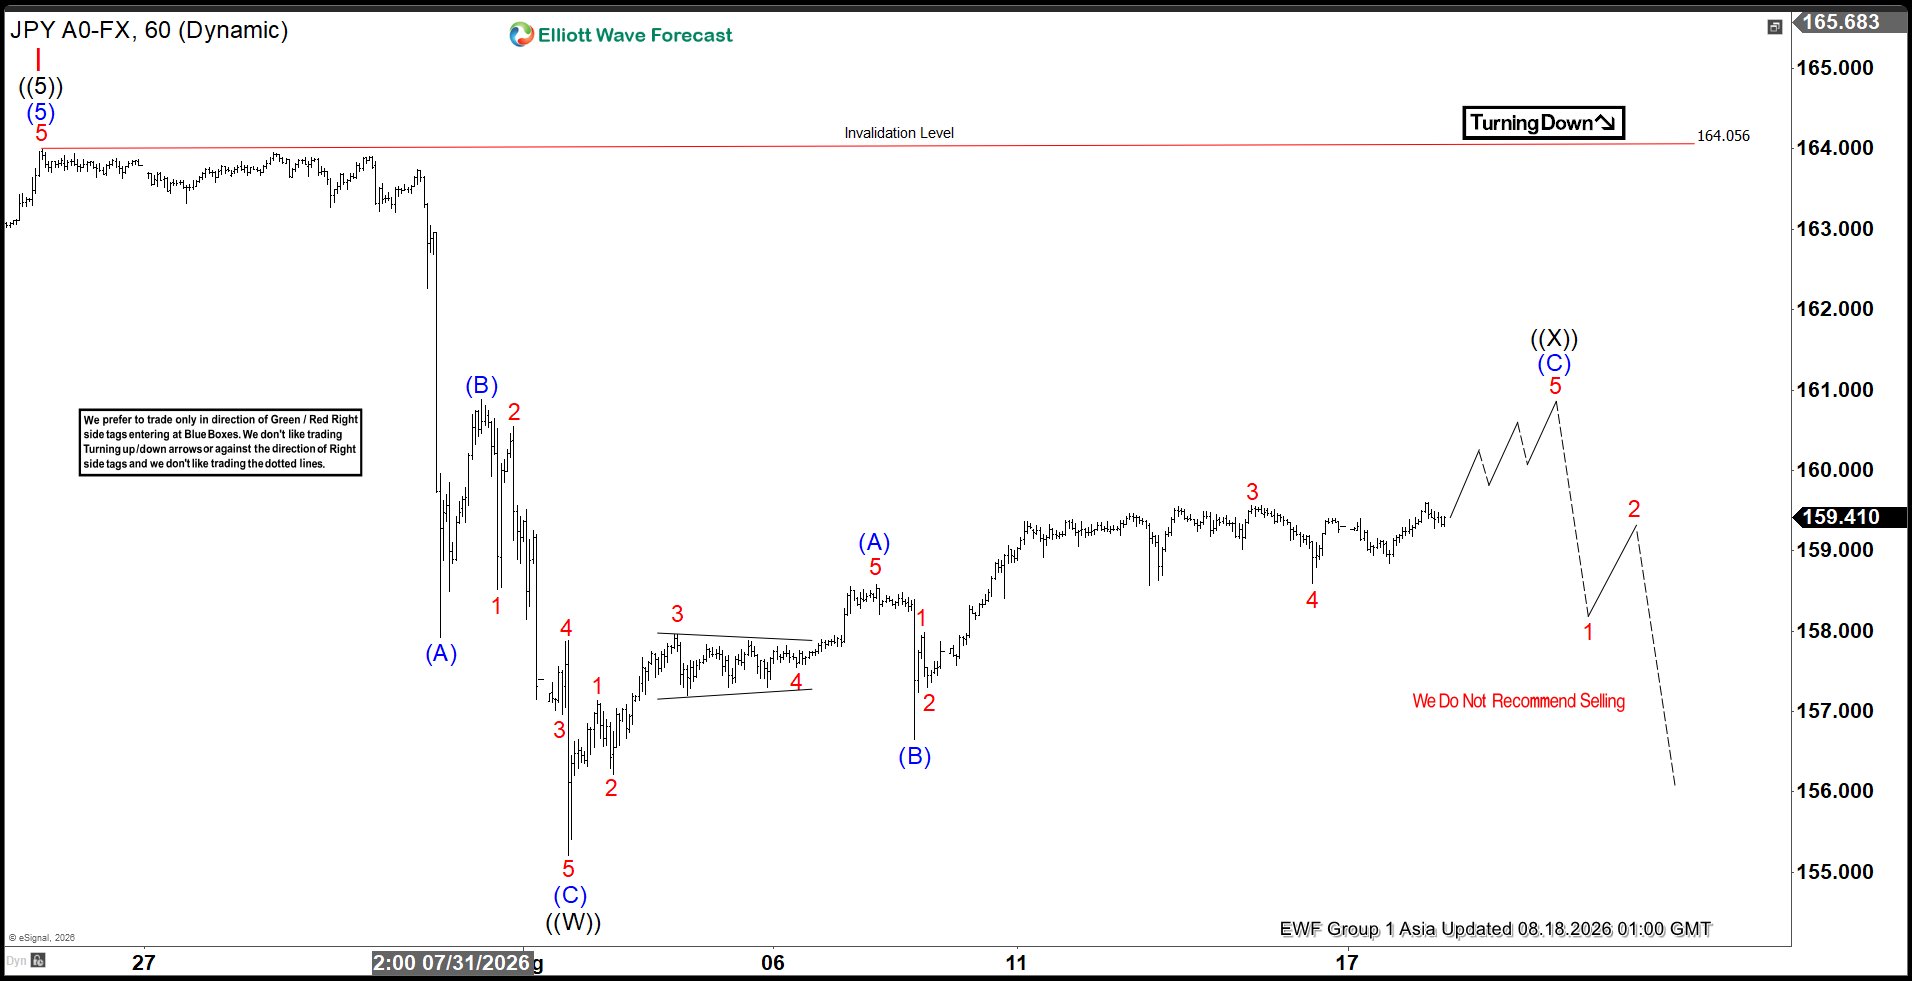
The chart from 08.18.2026 shows USDJPY completing a three‑wave corrective bounce, labelled wave ((X)), near the 161.00 handle. This counter‑trend recovery from the late‑July low unfolded as a clean (A)‑(B)‑(C) zigzag in ((W)). With the broader sequence favouring the downside, the 164.056 peak stood as the key invalidation level. The structural framework signalled a decisive ‘Turning Down’ move, projecting an aggressive bearish resumption once wave ((X)) concluded against that invalidation point. See below
The Impulsive Drop: 5 Waves Down to 152.50
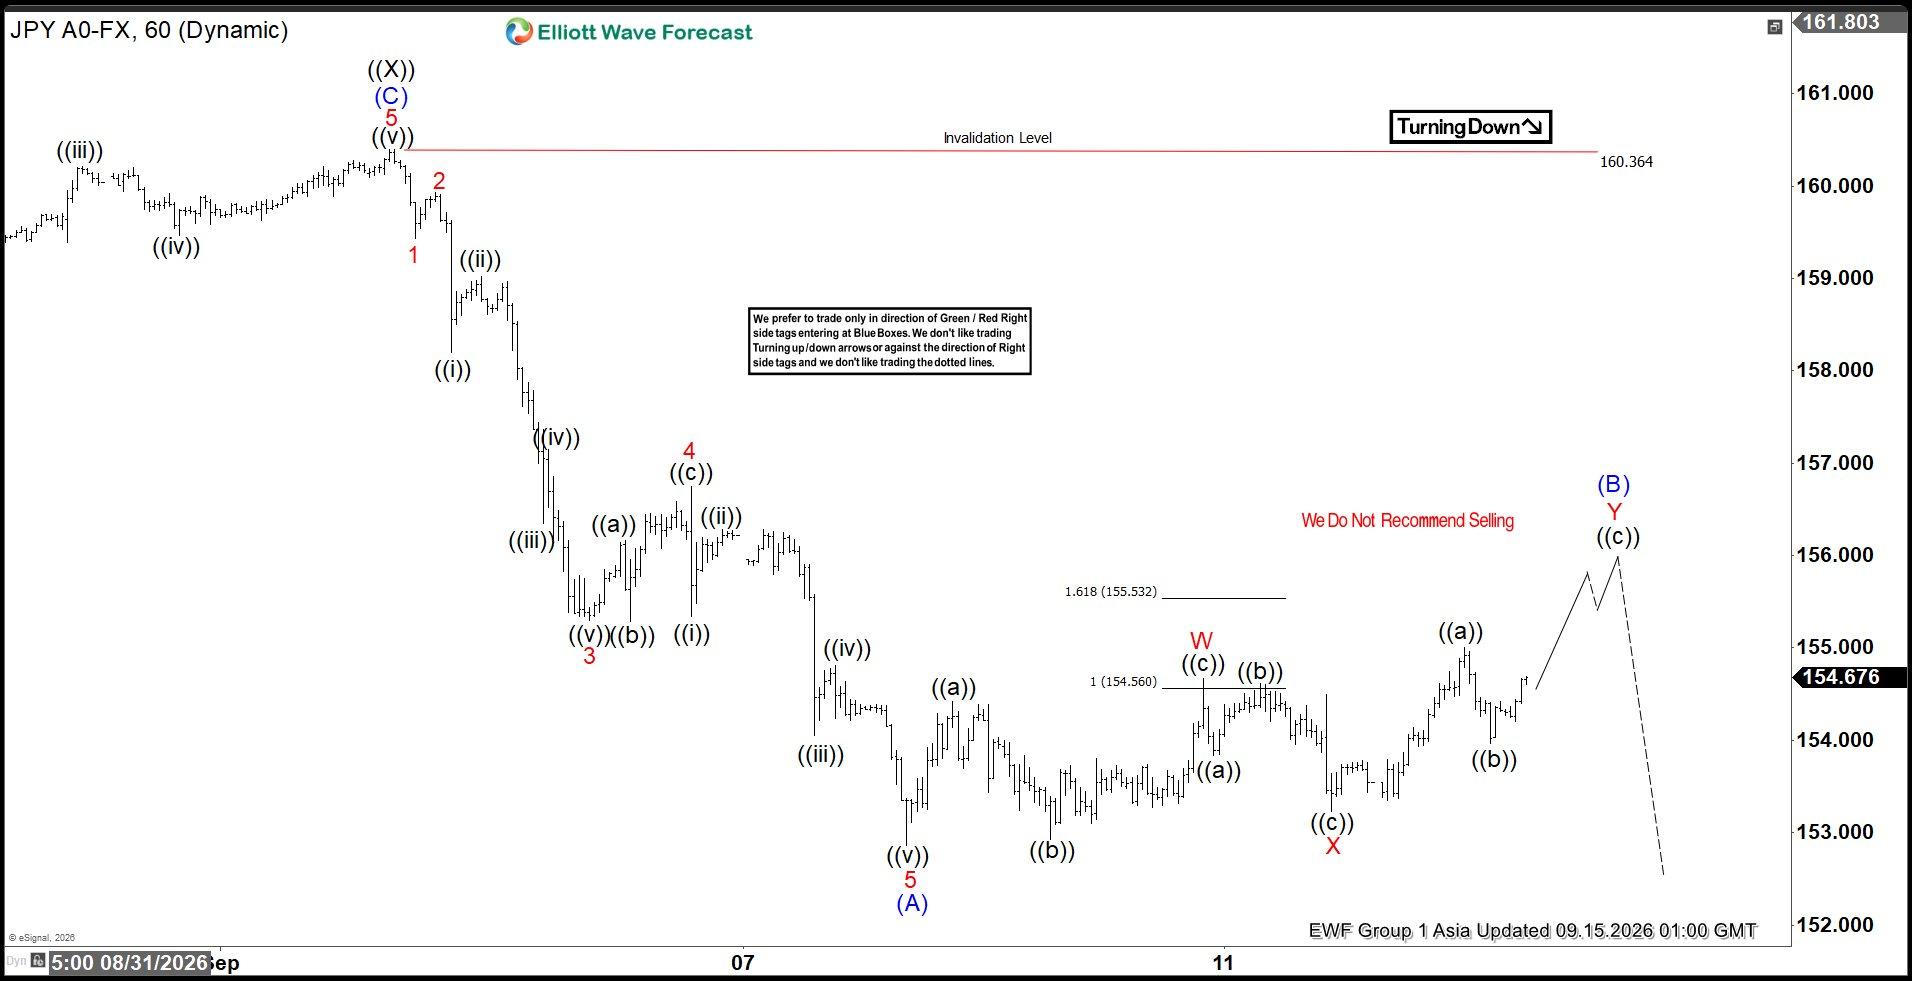
The subsequent price action confirmed the forecast with remarkable accuracy. As highlighted in the 09.15.2026 chart, USDJPY broke lower from the 160.364 peak, initiating a powerful five‑wave impulse sequence labelled wave (A). The decline cut through multiple support levels as sub‑waves 1 through 5 extended downward. Wave 3 drove the core of the sell‑off, followed by a brief wave 4 pause near 157.00, before wave 5 completed wave (A) around the 152.50 level. See below
Wave (B) Corrective Recovery and What’s Next
Following the completion of wave (A), USDJPY is now advancing in a multi‑leg corrective rally within wave (B). The consolidation is unfolding as a double three W‑X‑Y structure, with price lifting from the 153.00 floor to current levels near 154.67. Sub‑wave Y is projected to extend toward the 155.03–156.15 zone, aligning with the 100–1.618 Fibonacci extension. Once wave (B) completes its corrective pattern in this extreme area, the broader bearish cycle is expected to resume in wave (C), driving price toward fresh lows in the 151.56–146.11 Blue‑box area, where bulls are anticipated to step in for a turn higher after completing ((Y)) of II
Why choose EWF ?
At Elliottwave Forecast (EWF), we deliver consistent market updates through regular charts update. Our analysts update 1‑hour charts four times daily and 4‑hour charts once per day across all 78 instruments. In addition, we host five live sessions each day and maintain a 24‑hour chatroom, providing clients with real‑time market guidance and answers to any questions they may have.
You can start a 14‑day trial with us today here and cancel anytime by emailing support@elliottwave-forecast.com
Follow on X @NgcoboGen





