


TL;DR: Silver’s correction from 71.16 completed as a three-wave decline to 62.27, well above the $60 danger zone, with a firm break of 68.32 now the near-term test for whether the broader advance from 54.77 is resuming toward 80.32.
Silver’s extended rebound this week indicates the correction from 71.16 completed as a three-wave decline to 62.27. The metal held comfortably above the previously identified $60 support zone and has recovered through its daily and four-hour 55 EMAs. Immediate attention now turns to 68.32. A firm break would transform the move from a corrective rebound into stronger evidence that the broader advance from 54.77 is resuming.
That would initiate a five-step escalation of technical evidence rather than produce an unrestricted path higher. The sequence begins at 68.32, followed by the previous 71.16 peak, projection resistance at 72.46 and 78.76, and finally the major medium-term Fibonacci barrier at 80.32. Each break would strengthen the bullish case, but the larger structural move shouldn’t be considered confirmed before the full ladder is climbed.
The $60 Support Thesis Survives
The 62.27 low resolves the standing thesis that the $60 region should hold unless one of several specific downside triggers materialized. None did so cleanly. Gold tested but didn’t decisively break its 4,230–4,254 support zone. The Fed delivered a hawkish decision, but not one that materially exceeded what markets had already priced. Oil also avoided a fresh escalation capable of producing another abrupt rise in inflation expectations and Treasury yields.
Silver ultimately didn’t test $60. It bottomed at 62.27, leaving more than two dollars of room above the danger zone. That doesn’t by itself confirm a new medium-term advance, but it strengthens the earlier support call and shows sellers failed to generate the conditions required for a deeper breakdown.
Oil Relief and Lower Yields Support the Recovery
The macro environment has also become less hostile. Saudi Arabia confirmed that three pumping stations on its East-West pipeline were damaged in the September 10 drone strikes, leading to a full shutdown on September 11. The damage was worse than initially assessed, but Aramco is building a bypass around the affected section and expects to restore roughly half of the pipeline’s capacity within days. Satellite imagery from September 16 showed bypass construction underway, while full operations are targeted within five to six weeks.
Saudi Arabia is also supplying additional crude to Asian refiners through ship-to-ship transfers near Oman’s Sohar port, providing a second channel of relief from the immediate supply squeeze. The improvement is meaningful but incomplete. Karobaar Capital’s Haris Khurshid cautioned: “I wouldn’t call it an all-clear situation.” The market is recovering some capacity without fully restoring its margin for error.
The resulting pullback in oil has reduced immediate inflation pressure, while Treasury yields have moved lower. The US 10-year yield fell roughly 5bp around the FOMC announcement to approximately 4.95% and has since drifted toward 4.94%. That represents a continuing retreat from Tuesday’s 5.04% peak, the highest since 2007, rather than a single-session reaction. Lower oil reduces pressure on inflation expectations, while lower yields ease the opportunity-cost headwind facing non-yielding metals.
ActionForex’s Technical View on Silver: Bullish Divergence Supports the 62.27 Low
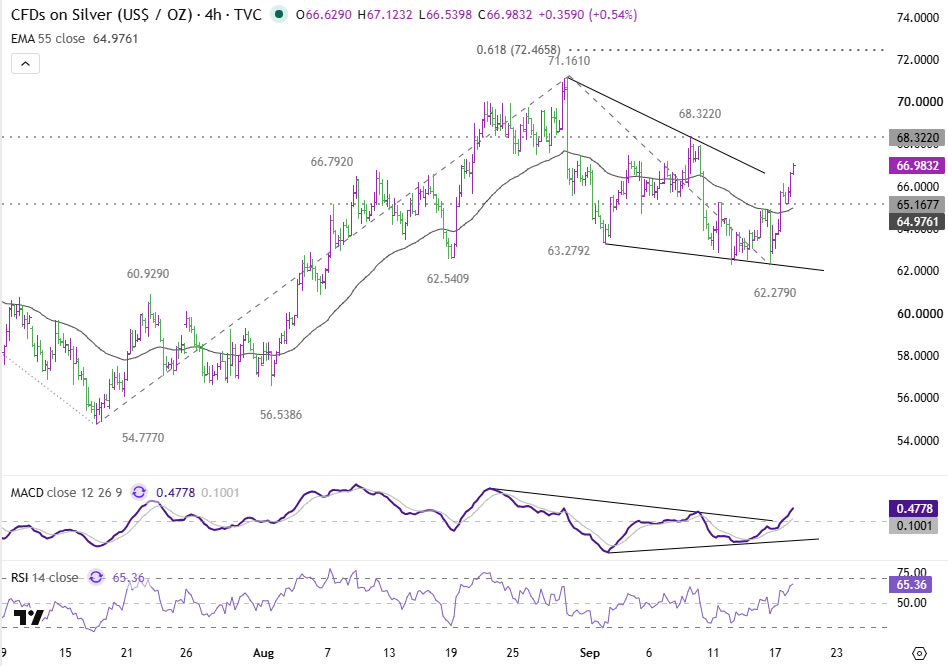
Silver’s fall from 71.16 developed as a three-wave structure. The first leg reached 63.28, the second rebounded to 68.32, and the final leg produced the 62.27 low. Price made a lower low on that final decline, but the four-hour MACD formed a higher trough, producing a bullish divergence.
Momentum has improved materially since then. The four-hour MACD has risen to 0.4778, above its 0.1001 signal line, while RSI at 65.36 shows strong momentum without yet reaching overbought territory. Silver has also reclaimed both its daily and four-hour 55 EMAs, which converge around 64.94–64.98.
The daily chart is less decisive but increasingly constructive. RSI has recovered to 55.68, while price is holding above the daily 55 EMA. The daily MACD remains below its signal line, meaning the larger bullish reversal still requires confirmation from price rather than momentum alone.
Five Steps From 68.32 to 80.32
The first hurdle is 68.32, the peak of the second wave within the decline from 71.16. A firm break would confirm the corrective pattern has been disrupted and add to the case that the broader advance from 54.77 is resuming.
The next target would be the 71.16 high. A break there would establish a fresh recovery high and expose the 61.8% projection of 54.77 to 71.16 from 62.27, at 72.46. That’s the first major test of whether the move can accelerate beyond merely recovering the September decline.
A decisive break of 72.46 could trigger stronger upside momentum toward the 100% projection at 78.76. That target sits close to 80.32, the 38.2% retracement of the long decline from 121.64 to 54.77. The proximity of those two levels creates a concentrated medium-term resistance zone.
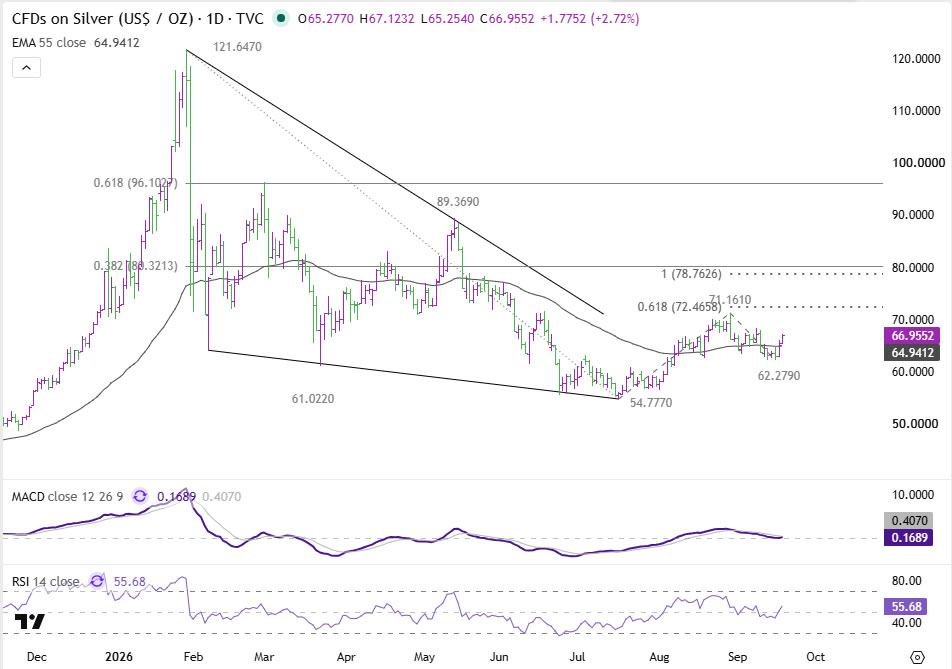
The distinction between 68.32 and 80.32 is important. A break of 68.32 would confirm the near-term bullish reversal. A sustained break of 80.32 would provide much more significant evidence that Silver is escaping the broader structure that has constrained it since the 121.64 peak.
Support Defines the Immediate Risk
On the downside, 65.16 is the first minor support. A break would dampen the immediate bullish case and suggest the rebound requires further consolidation. The daily and four-hour 55 EMAs around 64.94–64.98 provide the next support cluster.
A sustained fall below those averages would weaken the recovery more materially, while a break of 62.27 would invalidate the completed-correction thesis and bring the $60 region back into focus.
Silver has resolved the first question by holding above $60 and rebounding from 62.27. It hasn’t yet answered the larger one. 68.32 is the near-term referendum on whether the broader rally is resuming; 80.32 is the level that would determine whether that rally has developed into a more consequential structural breakout.
Key Takeaways
- Silver’s correction from 71.16 completed at 62.27, well above the $60 danger zone, after gold, the Fed, and oil all failed to deliver the deeper breakdown that would have tested that floor.
- Saudi Arabia’s East-West pipeline damage is being addressed with a bypass, with full capacity targeted in five to six weeks, easing the immediate oil-driven inflation pressure on precious metals.
- A four-hour bullish divergence (lower price low, higher MACD trough) supports the case that the decline from 71.16 has completed as a three-wave correction.
- 68.32 is the first confirmation level; clearing it opens a five-step path toward 71.16, 72.46, 78.76, and ultimately the major 80.32 medium-term resistance.
- A break below 62.27 would invalidate the completed-correction thesis and bring the $60 support zone back into focus.





