TL;DR: Gold and Silver both sold off as the U.S. 10-year yield surged to a fresh multi-decade high near 5.232%, but BMO Capital Markets’ new long-term forecasts show Silver trading nearly 30% above its structural anchor of $47, versus Gold sitting just 4% above its $4,000 anchor—leaving Silver far more exposed to a premium unwind.
Why This Matters
Gold and Silver are reacting to the same macro shock this week, but the size of the reaction is revealing something the yield move alone cannot explain. When two assets face an identical headwind and one falls considerably harder, the difference usually comes down to how much valuation cushion each was carrying going in. BMO’s latest research quantifies that cushion directly, and the gap it finds between Gold and Silver is large enough to reframe this week’s selloff as more than ordinary high-beta behavior.
For traders watching the Gold/Silver ratio and positioning across the precious-metals complex, that distinction matters for how much further Silver’s underperformance could run, and what would confirm or invalidate the thesis from here.
The Same Yield Shock, but a Very Different Valuation Gap
Gold and Silver are being hit by the same macro force this week: U.S. Treasury yields have surged again, lifting the opportunity cost of holding non-yielding assets and extending pressure across the precious-metals complex. But the reaction is exposing an important difference between the two metals.
The U.S. 10-year yield has climbed to around 5.232%, a fresh multi-decade high. Gold and Silver both sold off sharply as that move accelerated, but Silver again absorbed the larger hit. On Monday, spot Gold fell around -3.3% to 4,145.88, while Silver dropped close to -5% to 61.11. Silver miners fell harder again.
Part of that is normal—Silver routinely behaves as the higher-beta precious metal. But BMO Capital Markets’ latest forecasts suggest there may be more behind the divergence. Its new long-term Gold assumption of $4,000 an ounce sits only around 4% below current spot near 4,147. Silver’s new long-term assumption of $47, by contrast, is nearly 30% below current prices around 60–61 when measured as Silver’s premium above BMO’s anchor.
That does not make BMO’s numbers objective fair value. But it does expose an important asymmetry: Silver is carrying much more premium above the level BMO believes can be sustained structurally. And unlike Gold, part of the fundamental tightness supporting that premium is beginning to ease.
BMO Cuts Silver Harder for a Reason
The near-term forecast revisions tell the same story. BMO trimmed its Q4 Gold forecast by only around 2%, from $4,750 to $4,650. Its Silver forecast was cut much more sharply, by around 5.6%, from $71.40 to $67.40.
The reason is specifically Silver-related. BMO points to “faster-than-expected thrifting and slower solar deployment” as factors loosening industrial-market balances. Solar manufacturers are reducing the amount of Silver required in each cell through narrower metallization lines, increased copper substitution and wider use of silver-coated copper pastes.
That matters because industrial scarcity has been an important part of Silver’s 2026 re-rating. If manufacturers can reduce Silver intensity faster than expected just as deployment growth slows, one of the assumptions sustaining the metal’s scarcity premium weakens. BMO’s conclusion is unusually direct: it expects Silver to “underperform gold over the coming quarters.” That is not a call for Silver to collapse. It is a relative-value call.
Gold Is Near Its New Anchor. Silver Is Nearly 30% Above Its Own.
The longer-term forecasts make the distinction even clearer. BMO raised its long-term Gold assumption from $3,100 to $4,000, a 29% increase. Silver’s assumption rose from $36 to $47, an increase of roughly 31%. At first glance, the upgrades look almost identical. Relative to current prices, they are not.
Gold around 4,147 trades only about 4% above BMO’s $4,000 long-term anchor—in effect, BMO’s revised structural framework already accommodates most of Gold’s current price. Silver around 60.6–60.9 remains almost 30% above BMO’s $47 anchor.
That gap is where the premium-unwind thesis comes from. It suggests that a much larger share of current Silver pricing still relies on conditions remaining unusually tight—scarcity, physical-market stress, industrial demand and squeeze dynamics—while Gold is already much closer to the structural level BMO now regards as sustainable. So when yields rise, Silver has more than just rate sensitivity to contend with. It also has more premium available to compress.
This Is Not a Bear Call on Precious Metals
There is an important counterargument. BMO has raised the long-term assumptions for both Gold and Silver substantially. The broader structural case for precious metals remains intact in its framework, supported by themes including monetary debasement, central-bank demand and continued accumulation by the PBoC. BMO has also argued that Gold is increasingly decoupling from traditional real-yield relationships, suggesting that structural demand is changing how the metal responds to rates over longer horizons.
That means the current thesis should not be reduced to “Gold good, Silver bad.” The argument is narrower:
Both metals can retain strong long-term structural support while Silver simultaneously gives back more of the premium accumulated above its new long-term equilibrium assumption.
The distinction matters because the Gold/Silver ratio is now beginning to test exactly that proposition.
ActionForex’s Technical View on the Gold/Silver Ratio and Silver
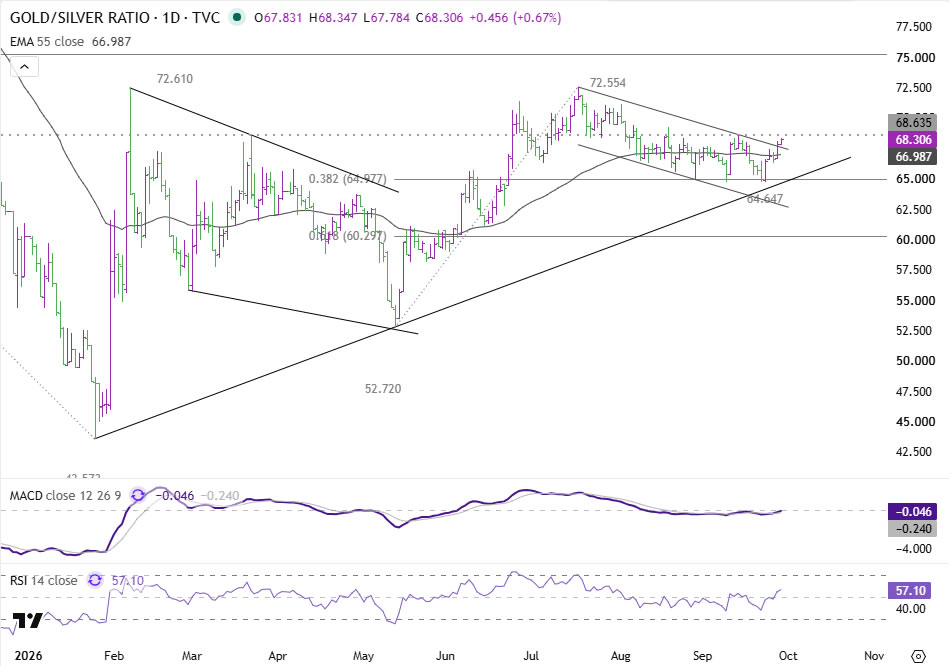
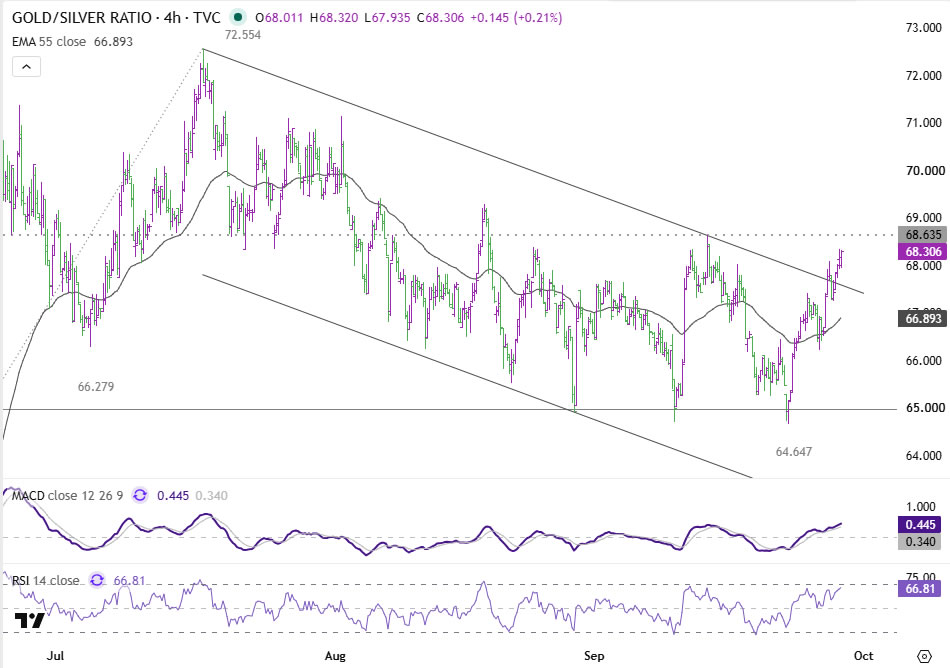
The Gold/Silver ratio has risen back to around 68.31 after repeatedly finding support near the 64.65–64.98 area. That support zone is technically important—it sits around the 38.2% retracement of the rally from 52.72 to 72.55, while the medium-term rising trendline has also remained intact. The ratio has now pushed through the upper boundary of the shorter-term descending structure from 72.55, suggesting that the corrective decline may have ended at 64.65. But the reversal still needs confirmation.
The market now has a clear progression of levels to watch:
- 68.64 tests whether the short-term reversal is genuine, with the weekly 55 EMA around 69.26 providing a second hurdle immediately above.
- 72.55, the previous swing high, tests whether Silver underperformance has enough momentum to extend.
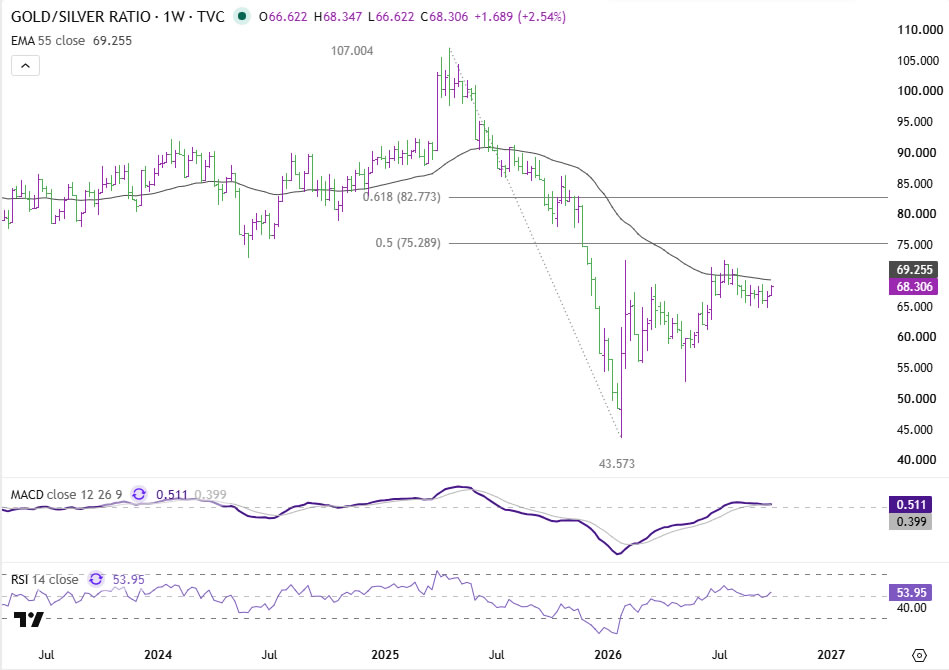
- 75.28, the 50% retracement of the much larger decline in the ratio from 107.00 to 43.57, tests whether something larger is changing.
Why 75.28 Matters More Than the Next Few Sessions
That last level is a very different technical threshold from 68.64. A move back through 75.28 would imply that Gold’s relative recovery against Silver is no longer merely a short-lived response to a yield spike, but a more meaningful repricing of the relationship between the two metals—one that would fit BMO’s fundamental view particularly well. If industrial Silver tightness continues to ease while Gold remains supported by central-bank demand and broader monetary themes, the ratio should eventually reflect that divergence. The ratio is therefore not merely another technical chart in this piece; it is the market test of the relative-value thesis.
Silver Breaks 62.30 as Downside Structure Extends
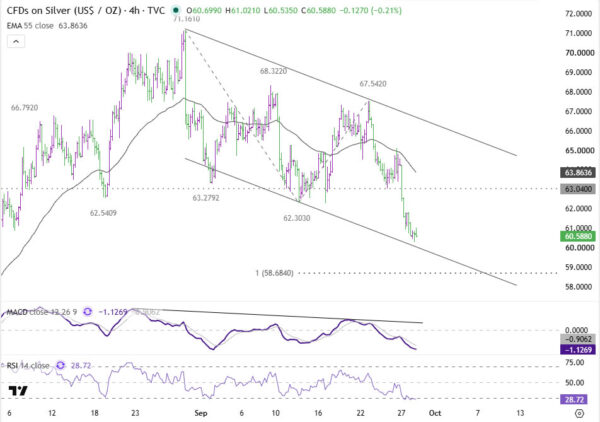
Silver’s own chart is already showing more damage. The fall from 71.16 resumed decisively this week and broke below 62.30 support. Price is also below both its daily and four-hour 55 EMAs, while momentum remains negative. Near term, 63.04—previously support—is the key resistance; as long as rebounds remain capped beneath it, the current decline remains in force.
 58.68 Separates Correction From Something More Serious
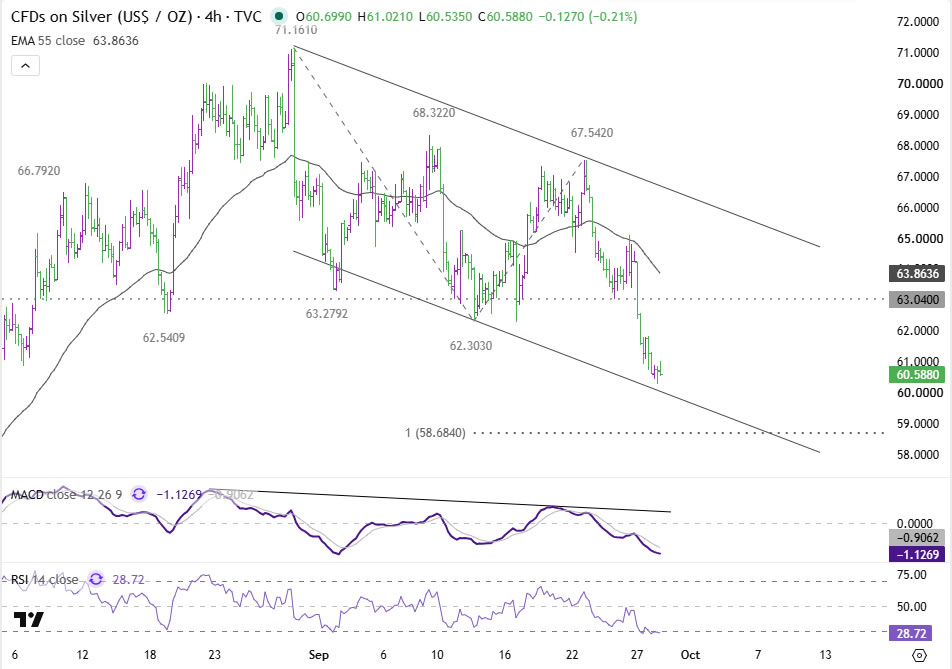
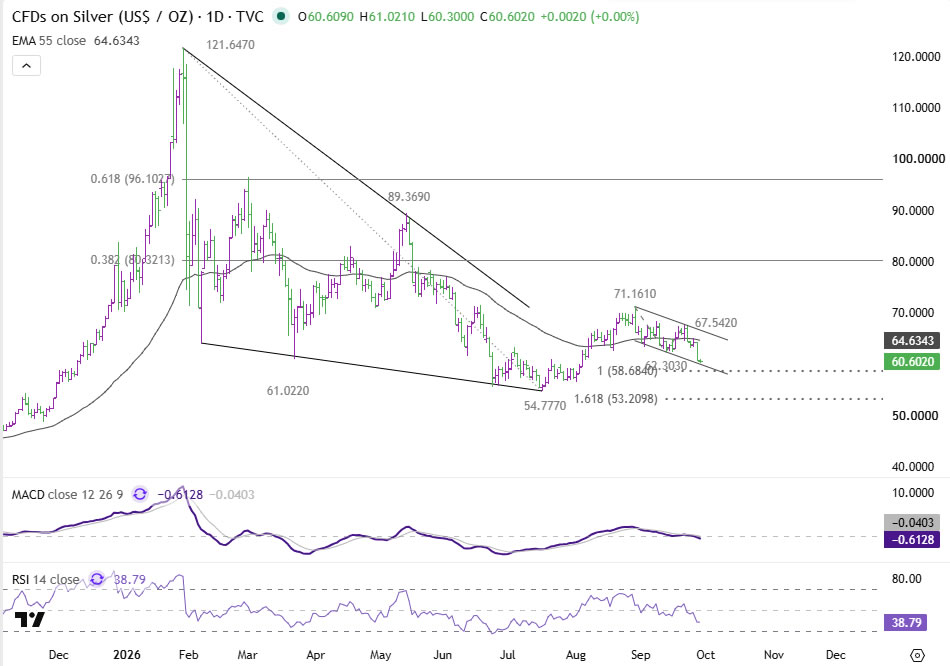
The next major downside objective is 58.68, the 100% projection of the 71.16–62.30 decline measured from 67.54. That level also sits close to the lower boundary of the broader descending structure, increasing its technical significance. The reaction there will determine whether Silver is simply unwinding its latest rebound or resuming a larger downtrend. If the fall from 71.16 remains corrective, strong support should emerge around 58.68 or above, ideally accompanied by stabilizing momentum or bullish divergence—keeping open the possibility that Silver is merely retracing part of the August advance before another recovery attempt.
A decisive break below 58.68 would carry a different message, exposing the 54.77 July low and then the 53.20 area, the 161.8% projection of the current decline. At that point, the premium-unwind argument would have moved beyond relative underperformance and into outright structural deterioration.
Three Signals Will Decide Whether the Premium Unwind Has Further to Run
The coming weeks offer three relatively clean tests.
- First, watch the 10-year Treasury yield—the move is already stretched, and signs of exhaustion there would ease pressure on both metals and could slow Silver’s decline.
- Second, watch 58.68 in Silver: holding it would preserve the corrective interpretation, while breaking it would materially increase the risk of a return toward 54.77 and 53.20.
- Third, watch the Gold/Silver ratio: a move above 68.635 would strengthen the immediate reversal, a break of 72.55 would make the underperformance more significant, and a later move through 75.28 would provide the strongest confirmation that Silver’s relative premium is undergoing something more substantial than a one-quarter reset.
The rates shock is common to both metals. The amount of premium they are carrying into it is not. And on BMO’s numbers, Silver still has considerably more to lose.
Key Takeaways
- Gold and Silver both sold off as the 10-year Treasury yield hit a fresh multi-decade high near 5.232%, but Silver fell nearly -5% versus Gold’s -3.3%.
- BMO’s new long-term anchors show Gold just 4% above its $4,000 fair-value estimate, while Silver trades nearly 30% above its $47 anchor.
- BMO cut its Silver forecast more sharply than Gold’s, citing faster industrial thrifting and slower solar deployment easing the metal’s scarcity premium.
- The Gold/Silver ratio has reclaimed 68.31; a break above 68.635, then 72.55, then 75.28 would each progressively confirm the Silver-underperformance thesis.
- Silver has broken 62.30 support and targets 58.68 next; a clean hold there keeps the decline corrective, while a break exposes 54.77 and 53.20.