


TL;DR: Gold briefly traded below $4,000 even as the US 10-year yield fell ~17bps to 4.96% on a tech-led equity selloff—a breakdown in the usual rate relationship that points to liquidity and positioning pressures, and possibly forced liquidation. The break below 4,066.21 support puts the 3,942–3,924 zone in immediate focus, with a deeper risk toward 3,750 if selling accelerates.
Why This Matters
Gold’s latest decline has exposed an unusual divergence across traditional defensive assets. While the technology-led equity selloff drove investors toward US Treasuries, pushing the 10-year yield down approximately 17 basis points to 4.96%, gold continued falling and briefly traded below $4,000. Inflation-adjusted Treasury yields also declined, yet the usual support from lower real interest rates failed to materialize. The contrast suggests that liquidity and positioning pressures may be outweighing gold’s traditional rate sensitivity, although forced liquidation has not been independently confirmed.
Technically, the break below 4,066.21 indicates that gold’s decline from 4,697.07 has resumed, potentially entering its fifth downward leg. The immediate focus is the 3,942–3,924 support region, where an initial rebound is possible. However, a decisive break would expose a deeper downside objective around 3,750. Nasdaq Composite support near 25,803 and the US 10-year yield’s position below 5% offer additional signals for assessing whether the broader defensive market adjustment is intensifying or stabilizing.
Gold Falls Despite Sharp Decline in Treasury Yields
Gold extended its decline on Thursday as selling in technology shares intensified, briefly dropping below the psychological $4,000 to an intraday low near 3,986 today. Silver also suffered a steeper decline, reflecting additional vulnerability to concerns about industrial demand and economic growth. The weakness in precious metals contrasted with the strong performance of US government bonds, where defensive buying drove Treasury yields sharply lower.
The divergence is particularly notable because the fall in Treasury yields was accompanied by a decline in real interest rates. The US 10-year nominal yield dropped from approximately 5.13% to 4.96%, while the corresponding inflation-adjusted yield eased from around 2.76% to 2.64%. Lower real yields ordinarily reduce the opportunity cost of holding non-yielding assets such as gold. Yet bullion failed to benefit, suggesting that other selling pressures were dominating its near-term price behavior.
The timing also matters. Gold’s decline began before the full Treasury rally developed, indicating that the initial selling cannot be attributed solely to liquidity pressures generated by the subsequent equity retreat. Nevertheless, gold’s continued weakness as real yields fell suggests that the traditional interest-rate relationship was not providing its usual support.
AI Selloff Drives Defensive Treasury Demand
US technology shares suffered another substantial setback as investors questioned the financing requirements and potential returns from large-scale AI investment. Nasdaq Composite fell approximately 2.6% on Thursday, its largest daily decline since June, while S&P 500 lost around 1.2%. Nvidia and other semiconductor-related companies were among the notable decliners, extending the pressure that had already affected Asian and European technology stocks.
The central concern has shifted from whether AI investment is generating revenue growth toward whether the scale of capital expenditure can deliver adequate financial returns. Recent corporate earnings have done little to settle that debate, leaving investors increasingly sensitive to investment guidance and funding requirements. The resulting weakness in technology shares encouraged defensive demand for Treasuries, pushing yields lower.
The Treasury rally reflected a search for safety, but gold did not participate. That divergence raises the possibility that investors were responding differently to the two assets: buying government bonds for protection while reducing liquid positions elsewhere to manage portfolio exposure. It also suggests that the market reaction involved more than a straightforward reassessment of interest-rate expectations.
Why Did Lower Yields Fail to Support Gold?
Liquidity-driven selling offers a plausible explanation for gold’s unusual underperformance. When equity markets decline, leveraged investors facing portfolio losses, margin requirements or tighter risk limits may need to raise cash quickly. Gold’s liquidity can make it a source of funds, even when its longer-term investment characteristics remain attractive. HSBC has highlighted how margin-related liquidation can undermine gold’s short-term effectiveness as an equity-market hedge, while Invesco has separately warned that investors may sell profitable gold positions to meet liquidity needs during periods of financial stress.
The latest price movements are consistent with that mechanism, particularly as gold weakened alongside technology shares despite falling nominal and real Treasury yields. A break through technical support may also have encouraged further position reductions, reinforcing the decline. However, the extent of forced selling remains unverified. There is insufficient contemporaneous evidence from ETF flows, futures transactions or margin data to establish how much of Thursday’s decline was attributable to leveraged liquidation.
Earlier speculative positioning provides some context. CFTC data showed managed-money net longs in COMEX gold futures declining from approximately 127,400 contracts in late September to 107,100 by October 13, indicating that bullish exposure was already being reduced before the latest selloff. Those figures do not capture Thursday’s trading, however, and cannot confirm whether liquidation subsequently accelerated. For now, the evidence supports an interpretation in which liquidity and positioning pressures temporarily overwhelmed the favorable interest-rate backdrop, rather than proving that forced selling was the dominant cause.
ActionForex’s Technical View: Gold, Fifth Downward Leg Targets 3,924
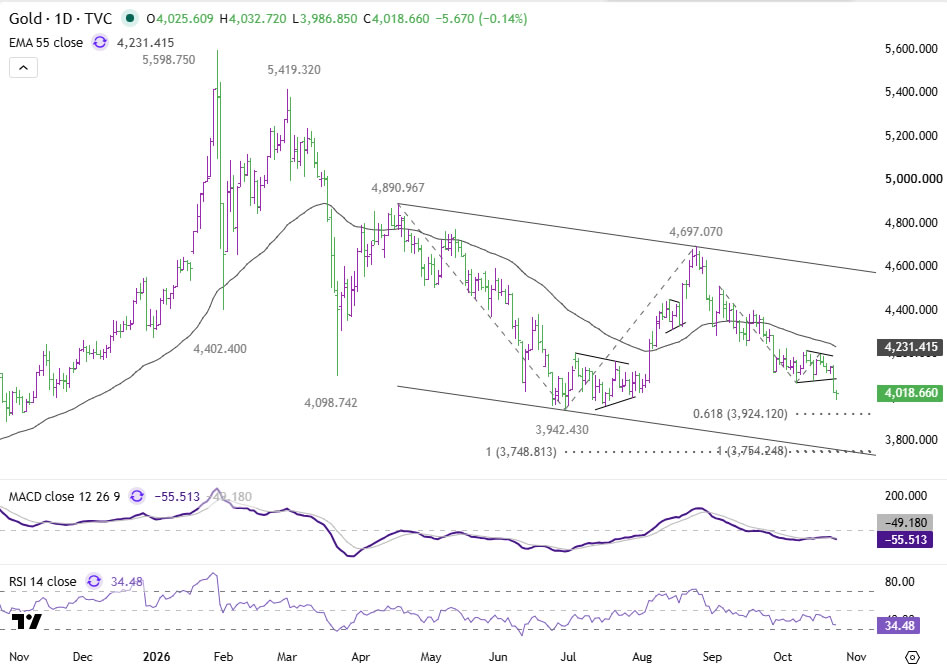
Gold’s break below 4,066.21 support suggests that the decline from 4,697.07 has resumed. Under the developing wave structure, the fall from 4,198.93 is interpreted as the fifth leg of the downward sequence, following the failure of the preceding recovery. Both the four-hour and daily charts remain under pressure, with prices trading below their respective 55 EMAs near 4,124 and 4,231.
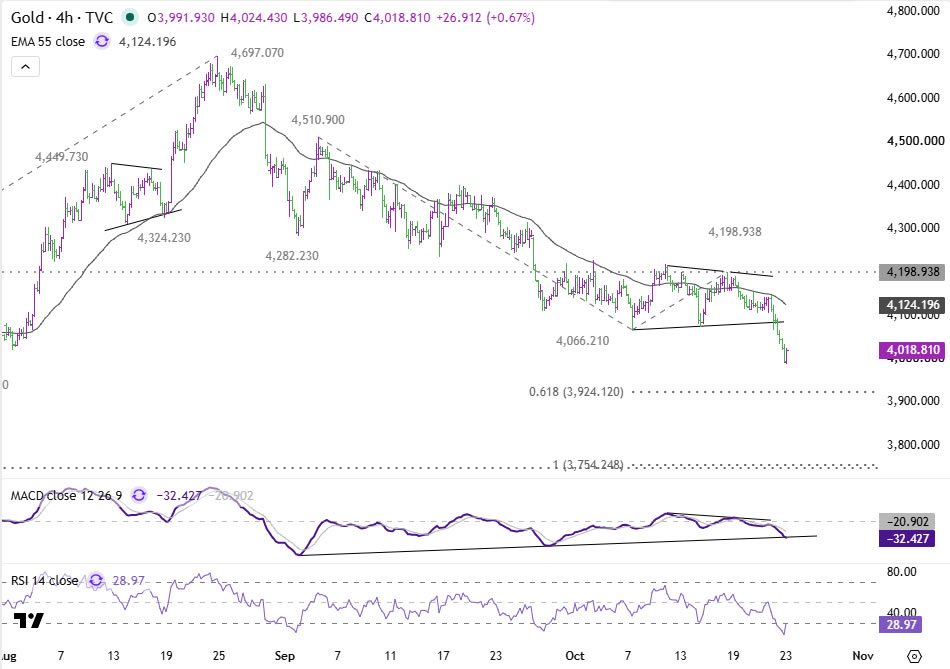
The immediate downside objective is the 61.8% projection of 4,510.90 to 4,066.21 from 4,198.93 at 3,924.12. This lies just below the previous low at 3,942.43, creating an important support region around 3,924–3,942. With the four-hour RSI near 29, selling momentum is becoming stretched, and an initial rebound from this area would not be surprising. Nevertheless, the near-term outlook would remain bearish while 4,198.93 resistance holds.
A firm break below 3,924.12 would indicate further downside acceleration toward the 100% projection at 3,754.24. This closely coincides with the larger daily projection around 3,748–3,749 and the lower boundary of the medium-term descending channel. The convergence makes 3,748–3,754 a potentially significant support area for a more durable bottom, should the current decline extend that far.
Nasdaq and Treasury Yields: Cross-Asset Tests of Market Stress
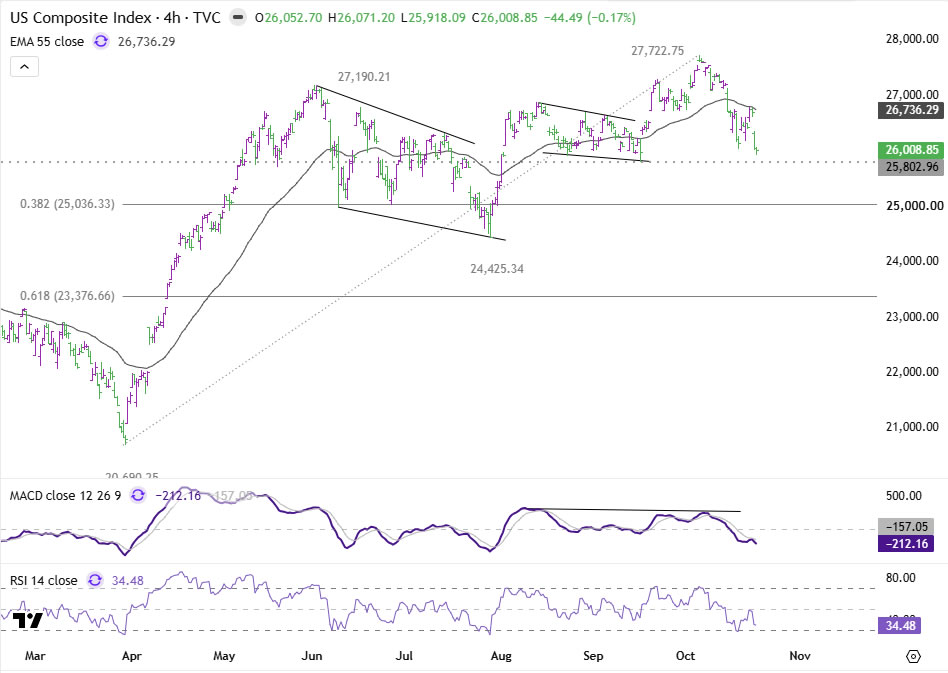
Two developments outside the gold market could help determine whether the conditions associated with its latest decline are intensifying. Nasdaq Composite is approaching important structural support at 25,802.96, following Thursday’s fall toward 26,009. A sustained break would indicate an extension of the equity decline, exposing the 38.2% retracement of the advance from 20,690.25 to 27,722.75 at approximately 25,036.35. Further equity weakness could increase portfolio risk-reduction pressures, although the technical break would not itself establish additional forced liquidation.
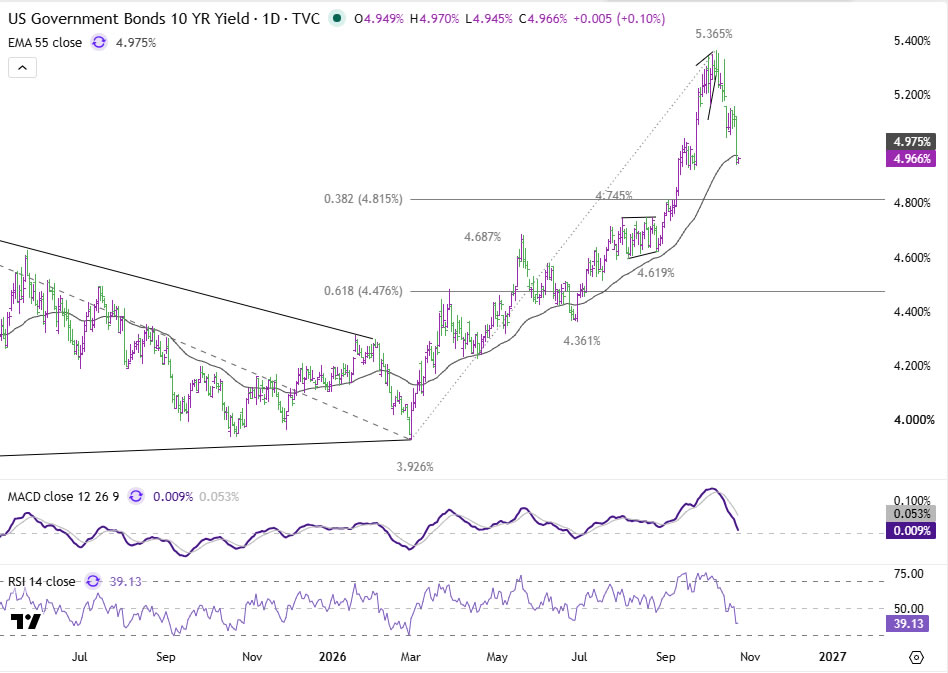
Meanwhile, the US 10-year Treasury yield has fallen toward its daily 55 EMA near 4.975% and below the psychological 5% threshold. Sustained weakness through this area would strengthen the case for an extension toward the 38.2% retracement of the rise from 3.926% to 5.365%, at approximately 4.815%. A recovery above 5%, particularly alongside stabilizing equities, would suggest that defensive Treasury demand may be easing.
The most revealing combination would be a break of Nasdaq support accompanied by a further decline in Treasury yields. If gold continued weakening under those conditions, the case for liquidity and positioning pressures overriding its traditional rate sensitivity would strengthen. Conversely, equity stabilization alongside reduced Treasury demand could suggest that the immediate defensive adjustment is losing momentum, potentially easing selling pressure on gold.
For now, gold’s failure to benefit from lower real yields remains the central market signal. While the precise scale of leveraged liquidation is uncertain, the technical breakdown keeps the 3,924 support region in focus, with a deeper decline toward 3,748–3,754 becoming a more credible risk if selling accelerates.
Key Takeaways
- Gold briefly traded below $4,000 even as the 10-year Treasury yield fell ~17bps to 4.96% and real yields declined—a breakdown in gold’s usual rate sensitivity that points to liquidity/positioning pressure, not confirmed forced selling.
- Nasdaq’s 2.6% drop (its worst since June) on renewed AI-financing concerns drove the defensive Treasury demand that gold failed to benefit from.
- CFTC data show managed-money gold longs already falling from ~127,400 to ~107,100 contracts between late September and October 13, though this predates Thursday’s selloff.
- Gold’s key technical level is 3,942–3,924 support (the fifth leg of the decline from 4,697.07); a firm break below 3,924.12 opens a deeper target near 3,748–3,754.
- Watch Nasdaq’s 25,803 support and the 10-year yield’s position below 5% together—a break of both while gold keeps falling would confirm liquidity pressures are dominating gold’s price action.