


Brent Oil’s $70–120 Iran War Range: What the Collapse Toward $95 Is Telling Markets
TL;DR: Brent Oil fell 8.7% on Wednesday to $94.62, reversing roughly half of its advance from $70.14 to $117.45 as markets removed part of the premium for a return to full-scale confrontation in the Iran conflict. That is not the same as pricing a settlement, and the first major test is the $88.21–93.80 support zone.
Why Is Brent Collapsing Toward $95, and What Does the $70–120 Range Mean?
Brent’s dramatic selloff has brought oil prices back toward $95, reversing roughly half of the advance from $70 to nearly $120 as investors reassess the risk of renewed military escalation in the Iran conflict. The decline suggests that markets are reducing the premium associated with a return to full-scale confrontation, but it does not mean they are pricing in a diplomatic settlement or a complete normalization of Middle Eastern oil supplies.
Brent futures plunged 8.7% on Wednesday, settling at $94.62, while WTI dropped 8.3% to $88.12. The selling extended into Thursday, leaving Brent approximately 17% below last Friday’s closing level in the supplied CFD series. The scale of the move reflects a substantial adjustment in geopolitical expectations following the Democratic sweep of Congress, although part of the decline began before the election results became clear.
The $70–120 range provides a useful framework for understanding the market’s changing assessment of the Iran conflict. Brent’s earlier low around $70 occurred during a period of greater optimism about eventual de-escalation and the normalization of shipping through the Strait of Hormuz. The subsequent advance toward $120 accompanied renewed military tensions, disruptions to regional energy transportation and growing fears of a return to full-scale conflict.
Now, with Brent near $95, the market has moved significantly away from the upper end of that framework. But the conditions associated with the lower end have not been restored. Although crude shipments have recovered substantially, transportation costs remain elevated, inventories are depleted and the outlook for global supply is disputed.
The central question is whether Brent is merely removing its most extreme escalation premium or beginning to reverse the entire geopolitical rally from $70. The answer will depend on both the evolution of the conflict and the technical response around a critical support zone between $88 and $94.
Follow Brent’s $88–94 test and the Iran conflict headlines on the ActionForex Telegram channel.
From $70 to $120: How the Iran Conflict Reshaped Oil Prices
The advance from 70.14 to 117.45 reflects a period in which the market’s assessment of geopolitical and supply risks changed substantially.
At the lower end, expectations of eventual de-escalation provided a more favourable backdrop for oil transportation and supply normalization. The subsequent deterioration in the regional security environment challenged those assumptions, as renewed military confrontation and shipping disruptions raised concerns about the availability and cost of Middle Eastern energy.
The escalation was not limited to the Strait of Hormuz. Attacks affecting regional shipping and infrastructure, alongside renewed concerns over other important transportation routes, increased uncertainty about the reliability of oil and refined-product supplies.
As those risks intensified, Brent approached $120, reflecting a market increasingly concerned about the consequences of renewed full-scale conflict.
The latest selloff has moved prices sharply away from that environment.
However, the two ends of the $70–120 range should be understood as historical reference points associated with different geopolitical expectations, not as precise prices for peace and war. Oil prices also respond to global demand, inventories, production and broader financial conditions.
At around $95, Brent has surrendered approximately half its rise from 70.14 to 117.45. That retracement illustrates the scale of the market adjustment, but does not imply that the probability of a geopolitical settlement has increased by any particular amount.
The distinction is especially important because the market has become less concerned about an immediate return to full-scale confrontation without receiving definitive evidence of a durable resolution.
Why the Market Is Moving Away From $120
The most immediate catalyst for the latest repricing has been the changing political landscape in Washington.
The Democratic sweep of Congress has raised questions about President Donald Trump’s ability and willingness to pursue further military escalation against Iran. With Republicans suffering substantial electoral losses and elevated fuel costs becoming a prominent political concern, investors are reassessing whether the administration will face greater pressure to contain the conflict.
Trump had already indicated before the election that he was not considering immediate additional strikes against Iran. Vice President JD Vance subsequently attributed Republican election losses to the war, reinforcing attention on its domestic political consequences.
These developments have encouraged expectations that the immediate risk of a major new military confrontation may have diminished.
According to the supplied Reuters reporting, sources familiar with Gulf governments’ thinking suggested that the changed political balance could increase incentives to seek a diplomatic outcome and make a full-scale assault less likely.
However, the easing in escalation expectations is not equivalent to an improvement in the probability of a negotiated settlement.
Analysts remain divided over whether the selloff has gone too far.
CIBC’s Rebecca Babin questioned the speed of the decline, suggesting that traders may have reacted aggressively to the political developments. Rapidan Energy’s Bob McNally, meanwhile, continued to see substantial risks of further escalation, given unresolved disagreements between Washington and Tehran.
Eurasia Group’s updated assessment highlighted the uncertainty. Its estimated probability of renewed US strikes declined only modestly from 65% to 60%, while the probability assigned to a negotiated agreement fell from 20% to 10%. The probability of a prolonged standoff increased from 15% to 30%.
- Renewed US strikes: probability down from 65% to 60%.
- Negotiated agreement: probability down from 20% to 10%.
- Prolonged standoff: probability up from 15% to 30%.
These estimates represent one firm’s scenario assessment rather than market consensus, but they reinforce an important point: lower expectations for immediate escalation do not necessarily translate into greater confidence that the conflict will end soon.
For Brent, this distinction is critical.
The retreat from nearly $120 is consistent with the removal of some extreme escalation expectations. Yet renewed strikes, further disruption to regional shipping or a breakdown in diplomatic contacts could quickly restore concerns about supply security.
The political outlook has changed, but the geopolitical risk has not disappeared.
Why Brent Has Not Returned Toward $70
The physical oil market presents a different picture from the rapid adjustment in financial-market expectations.
Crude shipments through the Strait of Hormuz have recovered close to pre-war levels, according to analysts cited by Reuters. However, those flows continue to face higher transportation costs, indicating that the broader trading environment has not fully normalized.
This matters because recovering volumes are only one measure of supply conditions.
Shipping security, transportation expenses, the availability of refined products and the level of commercial inventories also influence the market’s vulnerability to further disruption.
Analysts cited in the supplied research warned that oil inventories in major consuming economies were near their lowest levels in 15 years. The latest US inventory data also showed declines in crude, gasoline and distillate stocks.
Such conditions could leave the market sensitive to another interruption in supply, even if current export volumes have recovered substantially.
The gap between improved crude flows and continuing supply-chain risks helps explain why reducing the escalation premium is not the same as returning to a fully normalized oil market.
There is also a substantial disagreement over the underlying global supply balance.
JPMorgan estimates that the oil market returned to a surplus of approximately 1.1 million barrels per day in September, widening to 1.4 million in October. Its assessment reflects the recovery in Middle Eastern exports, additional Latin American supply and weaker consumption following the disruption caused by the conflict.
According to JPMorgan, Middle Eastern oil exports recovered from approximately 9.8 million barrels per day in March to 20.7 million, although they remained below pre-war levels.
HSBC has similarly revised its Saudi production forecasts higher, citing a faster-than-expected recovery in crude exports.
These developments suggest that the physical market may be rebuilding supply more rapidly than previously anticipated.
However, the International Energy Agency’s October assessment, as reported by Oil & Gas Journal, pointed in the opposite direction. It estimated a global deficit of approximately 790,000 barrels per day in September and projected continued supply shortfalls during the fourth quarter.
The difference between the IEA’s reported deficit and JPMorgan’s surplus estimate for September amounts to nearly 1.9 million barrels per day.
- JPMorgan: surplus of about 1.1 million barrels per day in September, widening to 1.4 million in October.
- JPMorgan: Middle Eastern exports recovered from about 9.8 million barrels per day in March to 20.7 million, still below pre-war levels.
- IEA (October assessment): global deficit of about 790,000 barrels per day in September, with shortfalls projected for the fourth quarter.
- Gap between the two September estimates: nearly 1.9 million barrels per day.
Differences in methodology, inventory coverage and reporting assumptions may partly explain the disagreement, but the broader implication is clear.
The global oil market cannot yet be described as having conclusively returned to surplus.
JPMorgan’s assessment supports the possibility that recovering supply is reducing scarcity pressures, while the IEA’s reported figures suggest that the physical market may remain tighter than the latest price decline implies.
This uncertainty is central to the $70–120 framework.
A sustained return toward the lower end would be more consistent with a broader normalization of geopolitical and physical supply conditions, potentially reinforced by evidence of excess supply.
But the market has not yet established that combination.
At around $95, Brent is trading between a reduced expectation of immediate full-scale escalation and continuing evidence of an oil market still exposed to supply and transportation risks.
ActionForex’s Technical View: Brent, the $88–94 Zone Tests the Broader Rally
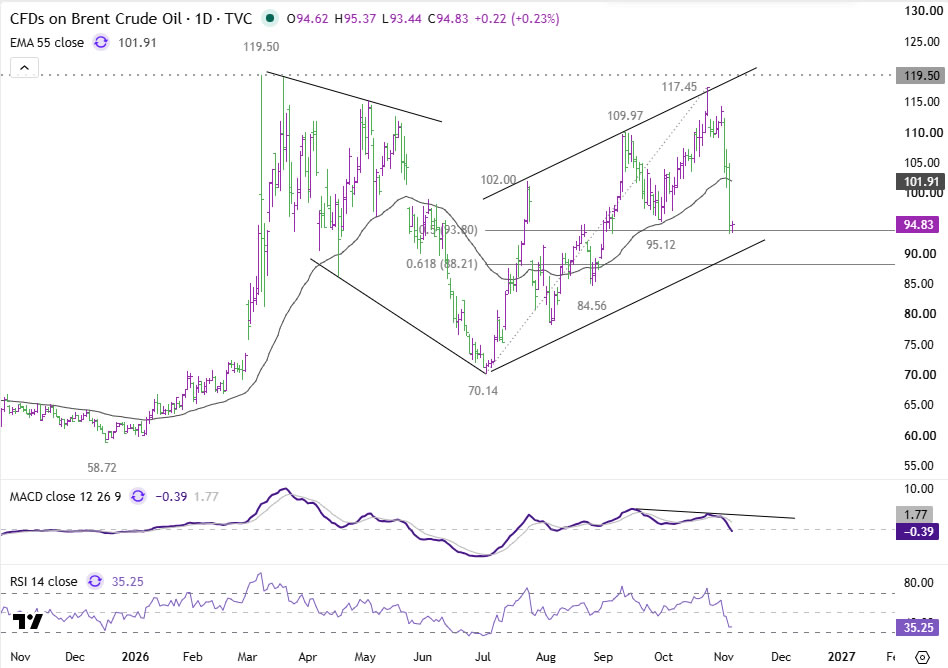
Brent’s sharp decline this week and the breach of 95.12 support suggest that the advance from 70.14 has completed at 117.45.
However, it remains too early to conclude whether the current decline is reversing the entire advance or merely correcting it.
The immediate focus is a key Fibonacci support zone between 88.21 and 93.80, representing the 61.8% and 50% retracements of the rise from 70.14 to 117.45.
This zone has particular significance because it lies near the midpoint of the broader $70–120 framework.
Brent’s latest decline has already brought prices into the upper part of this support region, with Thursday’s intraday low near 93.44 followed by a recovery toward $95.
Strong support could emerge within the 88.21–93.80 zone and complete the pullback from 117.45.
A rebound toward $100 is possible as the intense selling pressure subsides. Nevertheless, near-term risk will remain on the downside unless Brent achieves a sustained break above the daily 55 EMA, currently around 101.92.
Such a recovery would strengthen the argument that the fall from 117.45 has completed as a correction, reopening the way toward the 117.45–119.50 resistance zone.
Until then, a rebound alone would not be sufficient to establish that the broader upward trend remains intact.
Conversely, a decisive break below 88.21 would indicate that Brent is reversing the entire advance from 70.14, rather than merely correcting it.
That would bring 84.56 support into immediate focus, with scope for a deeper decline toward 70.14.
The daily MACD has turned negative following bearish divergence from the earlier highs, while RSI has fallen toward 35, indicating substantial downward momentum.
Although the decline has become extended, the momentum indicators do not yet establish that selling pressure has exhausted itself.
The technical outlook therefore aligns with the broader macroeconomic uncertainty.
A sustained rebound from 88.21–93.80 would be consistent with Brent retaining substantial support despite the repricing of escalation risks. A decisive breakdown would instead indicate that the market is moving toward a more extensive reversal of the entire geopolitical advance.
Neither technical outcome would, by itself, establish a particular diplomatic or supply scenario.
What Would Move Brent Toward Either End of the Range?
The latest selloff has changed the market’s assessment of geopolitical risks, but it has not resolved the underlying conflict or the uncertainty over global oil supply.
At the upper end of the framework, renewed military escalation, significant shipping disruptions or evidence of persistent physical shortages could restore upward pressure on Brent.
At the lower end, durable de-escalation, more predictable oil transportation and convincing evidence of improving supply availability would be more consistent with a sustained decline toward earlier price levels.
The immediate question is whether the market has already removed enough escalation risk to stabilize prices around the current support zone.
Brent’s response between 88.21 and 93.80 will be the first major test.
A sustained recovery above the daily 55 EMA near 101.92 would strengthen the case that the decline from 117.45 was corrective, potentially reopening the way toward the upper end of the range.
A decisive break below 88.21 would instead suggest that the entire advance from 70.14 is being reversed, bringing lower support levels into focus.
Developments in US-Iran relations, shipping conditions, inventories and the conflicting assessments of global supply will determine whether either scenario gains fundamental support.
Brent’s $70–120 range remains a useful framework for interpreting how the market is reassessing the Iran conflict. The collapse toward $95 suggests that expectations of renewed full-scale escalation have receded, but it does not establish that the conditions for a return toward $70 have emerged.
For now, the market is positioned between those two interpretations, with the next technical break likely to reveal which is gaining greater traction.
Key Takeaways
- Brent futures fell 8.7% on Wednesday to $94.62 (WTI −8.3% to $88.12), reversing roughly half of the advance from 70.14 to 117.45.
- The Democratic sweep reduced expectations of renewed escalation, but Eurasia Group still sees a 60% chance of renewed US strikes and only a 10% chance of a negotiated agreement.
- Supply estimates conflict: JPMorgan sees a surplus of about 1.1 million barrels per day in September, while the IEA reported a deficit of about 790,000, leaving the market not conclusively in surplus.
- The key support zone is 88.21–93.80 (61.8% and 50% retracements); a decisive break below 88.21 would bring 84.56 into focus and indicate a reversal of the entire advance.
- A sustained break above the daily 55 EMA near 101.92 would suggest the decline was corrective and reopen 117.45–119.50.
Stay ahead of Brent’s next move as markets reassess the Iran conflict—join the ActionForex Telegram channel for regular market updates and analysis.