


TL;DR: Gold has rebounded to around 4,118 after gaining 5.02% last week, driven more by falling oil prices and lower Treasury yields than by safe-haven demand. Tuesday’s US CPI report could decide whether the recovery clears the 4,160–4,200 resistance cluster or stalls inside a larger downtrend.
Is Gold’s Rebound Driven by Safe-Haven Demand or Easing Inflation Fears?
Gold extended its recovery on Monday, trading around 4,118 after rebounding from the October 30 low of 3,869.96. The metal gained 5.02% last week, supported by a sharp decline in oil prices and lower US Treasury yields, even as the Dollar edged higher over the week. The rebound marks a significant recovery from recent selling pressure, but its underlying drivers suggest that easing inflation and interest rate concerns have played a greater role than traditional safe-haven demand. With Gold now approaching a cluster of technical resistance between 4,160 and 4,200, Tuesday’s US CPI report could become an important test of whether the advance can develop into a more substantial bullish reversal.
Falling Yields and Oil Prices Support Gold’s Recovery
Gold’s performance last week showed a relatively consistent relationship with Treasury yields, while its response to equity-market turmoil was less convincing. The strongest advance came on Wednesday, when Gold surged 3.36% as Brent crude plunged 9.26%, the US 10-year yield fell 7.6bps, and the Dollar weakened 0.39%. Thursday’s severe technology-sector selloff, by contrast, produced a comparatively modest 0.64% gain in Gold, despite an 11.2bps decline in the US 2-year yield.
Friday’s stronger-than-expected US employment report interrupted the recovery but did not reverse it. Nonfarm payrolls increased by 165K in October, reinforcing expectations for further Fed tightening. The US 2-year yield rose 4.1bps, the Dollar Index gained 0.70%, and Gold slipped 0.43% to close at 4,069.63. Across the week, however, the US 10-year yield declined 7.4bps and the 2-year yield fell 8.2bps, while Brent lost 13.6%.
- Wednesday: Gold +3.36% as Brent fell 9.26%, the 10-year yield fell 7.6bps and the Dollar weakened 0.39%.
- Thursday: Gold +0.64% in the tech rout, despite the 2-year yield dropping 11.2bps.
- Friday: Gold −0.43% to 4,069.63 after payrolls of +165K; 2-year yield +4.1bps, Dollar Index +0.70%.
- Week: Gold +5.02%, 10-year yield −7.4bps, 2-year yield −8.2bps, Brent −13.6%.
These movements suggest that the reduction in energy-driven inflation concerns and the associated decline in yields have been more important to Gold’s recovery than defensive demand generated by equity weakness. The relationship is not conclusive, given the short observation period and overlapping movements in oil, yields and the Dollar. Nevertheless, the contrast between Gold’s strong advance during Wednesday’s oil-led relief and its muted response to Thursday’s equity rout provides a useful indication of the forces currently influencing prices.
Follow Gold and Tuesday’s US CPI reaction on the ActionForex Telegram channel.
US CPI to Test Inflation Expectations and Fed Pricing
Attention now turns to Tuesday’s October US CPI report, scheduled for 13:30 GMT. Headline inflation is expected to moderate from 0.6% mom to 0.3%, while the annual rate is forecast to rise from 3.7% to 3.9%. Core CPI is expected to slow from 0.3% mom to 0.2%, although its annual rate is projected to increase from 2.6% to 2.8%.
- Headline CPI: 0.6% to 0.3% mom; annual rate 3.7% to 3.9%.
- Core CPI: 0.3% to 0.2% mom; annual rate 2.6% to 2.8%.
The distinction between headline and underlying inflation will be particularly important. September’s inflation was heavily influenced by energy prices, with gasoline costs rising 9.1% mom. However, the sharp decline in Brent from 113.41 on October 30 to 97.98 on November 6 occurred after the October reporting period. Consequently, Tuesday’s data will not capture that subsequent energy-price relief.
A stronger-than-expected core reading could reinforce concerns about persistent inflation and encourage markets to price a more restrictive Fed path. Conversely, softer underlying inflation could ease pressure on Treasury yields and the Dollar, creating more favorable conditions for Gold to extend its recovery.
However, much of the immediate tightening outlook is already reflected in market pricing. CME FedWatch indicated an 80.5% probability of a December rate hike in the latest available reading, compared with 70.7% on October 30. The more consequential question may therefore be whether CPI materially changes expectations for additional tightening in 2027, rather than simply confirming the already favored December move.
The reaction will also depend on competing influences. Renewed geopolitical escalation could lift oil prices and inflation concerns, while further technology-sector weakness could generate demand for Treasuries or defensive assets. CPI is therefore an important catalyst, but neither a necessary nor sufficient condition for Gold to break resistance.
ActionForex’s Technical View: Gold, Recovery Meets Critical Resistance
Four-Hour Chart — Short-Term Bottom Established
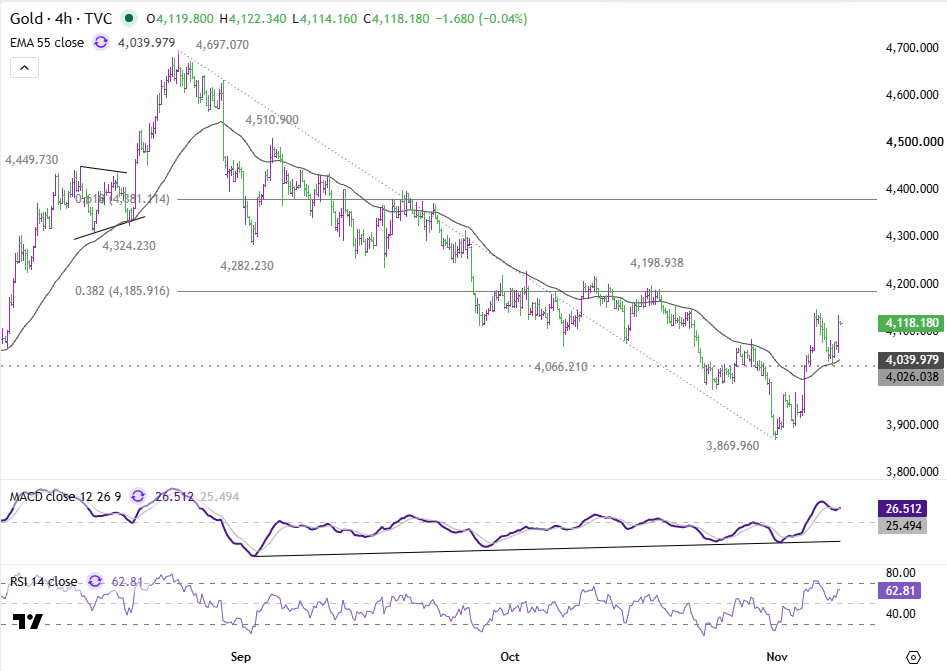
Gold’s strong rebound from 3,869.96 suggests that a short-term bottom has formed. The recovery has carried price back above the four-hour 55 EMA, currently near 4,040, while momentum indicators have improved. This supports the prospect of further near-term upside, but the advance is approaching more substantial resistance on the daily and weekly timeframes.
Daily Chart — 4,200 Is the Decisive Barrier
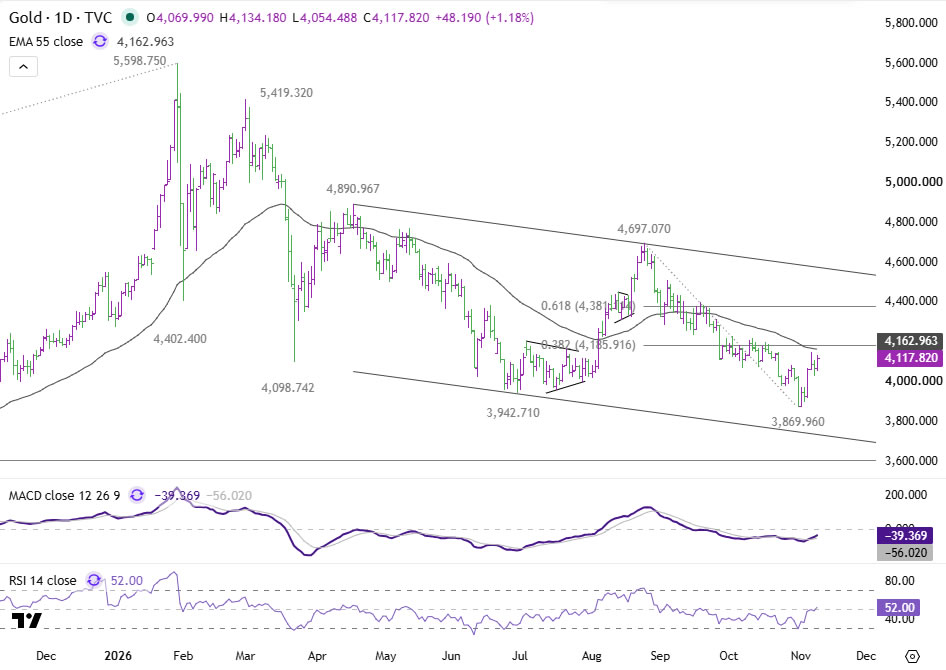
The immediate focus is the broad 4,100–4,200 resistance zone, particularly the concentration of technical barriers near its upper boundary. These include the daily 55 EMA around 4,163, the 38.2% retracement of 4,697.07 to 3,869.96 at 4,185.91, structural resistance at 4,198.93, and the psychological 4,200 level.
As long as this resistance zone caps the recovery, the rebound from 3,869.96 could still develop into a corrective pattern within the decline from 4,697.07, leaving the near-term outlook bearish.
Rejection from the resistance zone, followed by a break below 4,026.03 support, would indicate renewed selling pressure and bring a retest of 3,869.96 into focus. A further break below that low would extend the larger downtrend, with the next downside target at 3,606.83, the 50% retracement of the advance from 1,614.92 to 5,598.75.
Conversely, a decisive break above 4,200 would strengthen the argument that Gold is reversing the entire decline from 4,697.07. That would open scope for a stronger rebound toward 4,381.11, the 61.8% retracement of 4,697.07 to 3,869.96.
Weekly Chart — Larger Bearish Structure Still Intact
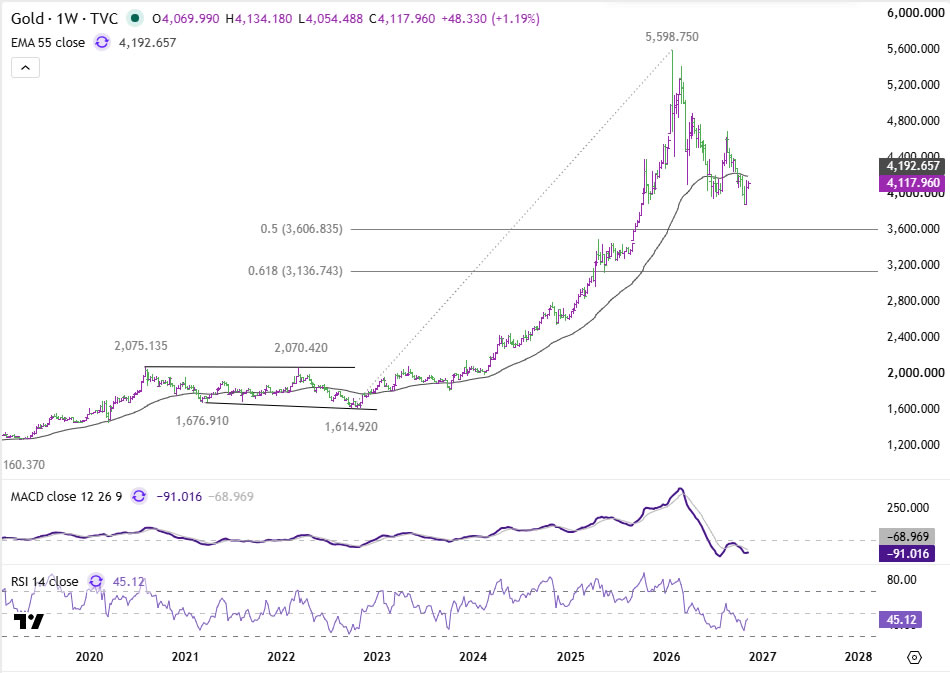
The weekly chart reinforces the importance of the current resistance zone. The weekly 55 EMA, around 4,193, sits directly within the same cluster, adding another obstacle to the recovery.
Even a decisive break above 4,200 would not necessarily establish a reversal of the broader downtrend from the record high of 5,598.75. It would initially provide stronger evidence that the decline from 4,697.07 has ended, while the larger bearish structure would require additional confirmation.
Gold therefore enters Tuesday’s inflation report at an important technical decision point. A sustained break above 4,200 would shift the immediate outlook toward a stronger recovery, while rejection followed by a loss of 4,026.03 would revive the risk of another decline toward 3,869.96. The decisive factor may be less the CPI surprise itself than whether its impact on Fed expectations, Treasury yields and the Dollar provides sufficient momentum to resolve this resistance test.
Key Takeaways
- Gold gained 5.02% last week and trades around 4,118, with the rebound tied more closely to falling oil (Brent −13.6%) and yields than to safe-haven demand.
- Gold surged 3.36% on Wednesday’s oil-led relief but gained only 0.64% on Thursday’s tech rout, a contrast that points to oil and yields as the main drivers.
- Tuesday’s October US CPI is forecast at 0.3% mom headline (3.9% annual) and 0.2% mom core (2.8% annual), and will not capture the energy-price drop that followed the reporting period.
- The 4,160–4,200 resistance cluster (daily 55 EMA near 4,163, 38.2% retracement at 4,185.91, 4,198.93, weekly 55 EMA near 4,193) is the decisive test.
- A break above 4,200 opens 4,381.11, while rejection and a loss of 4,026.03 would revive the risk of a retest of 3,869.96, then 3,606.83.
Stay ahead of Gold’s test at 4,200 and the US CPI impact on Fed expectations—join the ActionForex Telegram channel for regular market updates and analysis.